Understanding your portfolio
In this article we will dive deep into a sector of our portfolio and better understand how each holding is contributing to the overall gains
For illustration purposes, we will use the demo account.
Table of Contents
- Is the portfolio diversified enough?
- Understanding the Technology sector
- News, Financial Data and Fundamentals
Is the portfolio diversified enough?
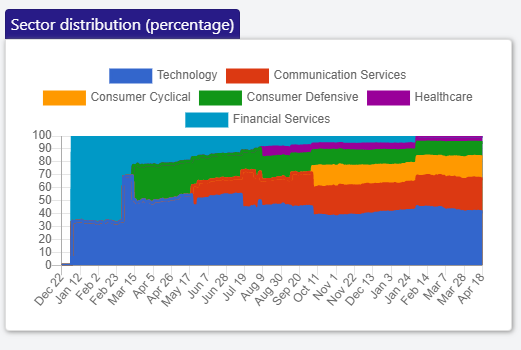
To check that, we go to the portfolio level charts at Charts -> Portfolio and we check the sector distribution chart
Understanding the Technology sector
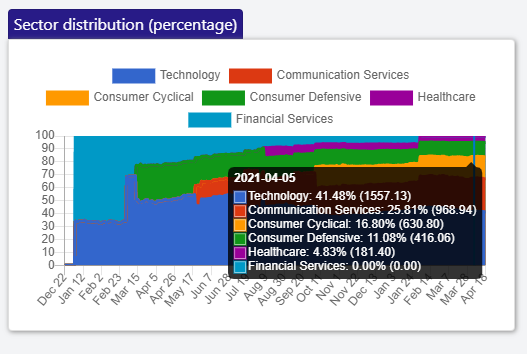
From the chart, we can see that 41% of our portfolio is invested in the Technology sector. Depending on your risk tolerance, this might be more than you affort to lose in case the Technology sector goes down.
Let's try to understand what investments we made in the Technology sector
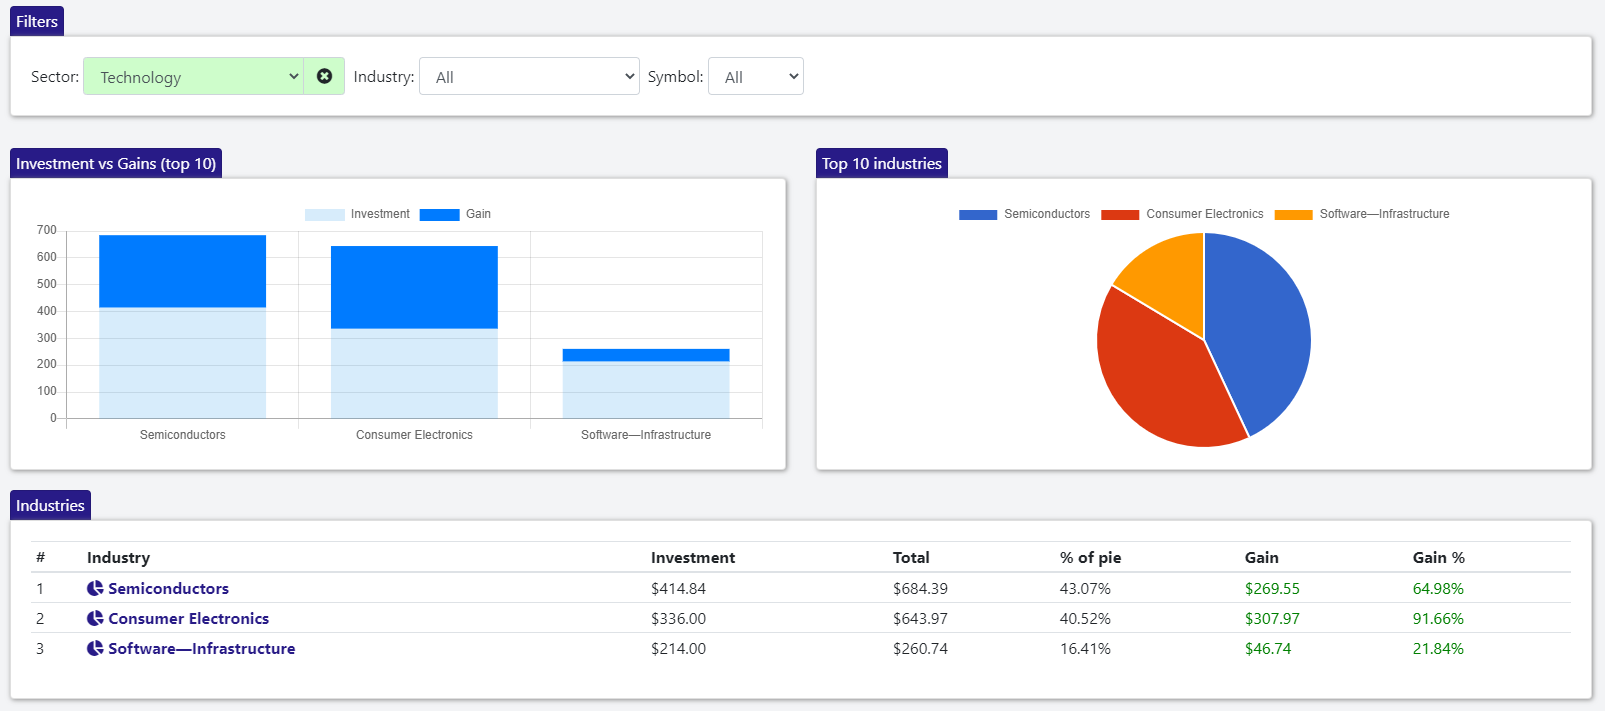
We can now see that currently most of the money went into the Semiconductors and Consumer Electronics industries. The two industries performed really well over time with both returning a profit of more than 50%
But we can also see that we invested in Software-Infrastructure, which only had a 22% gain. Let's dive deep into this industry to understand what companies are part of it
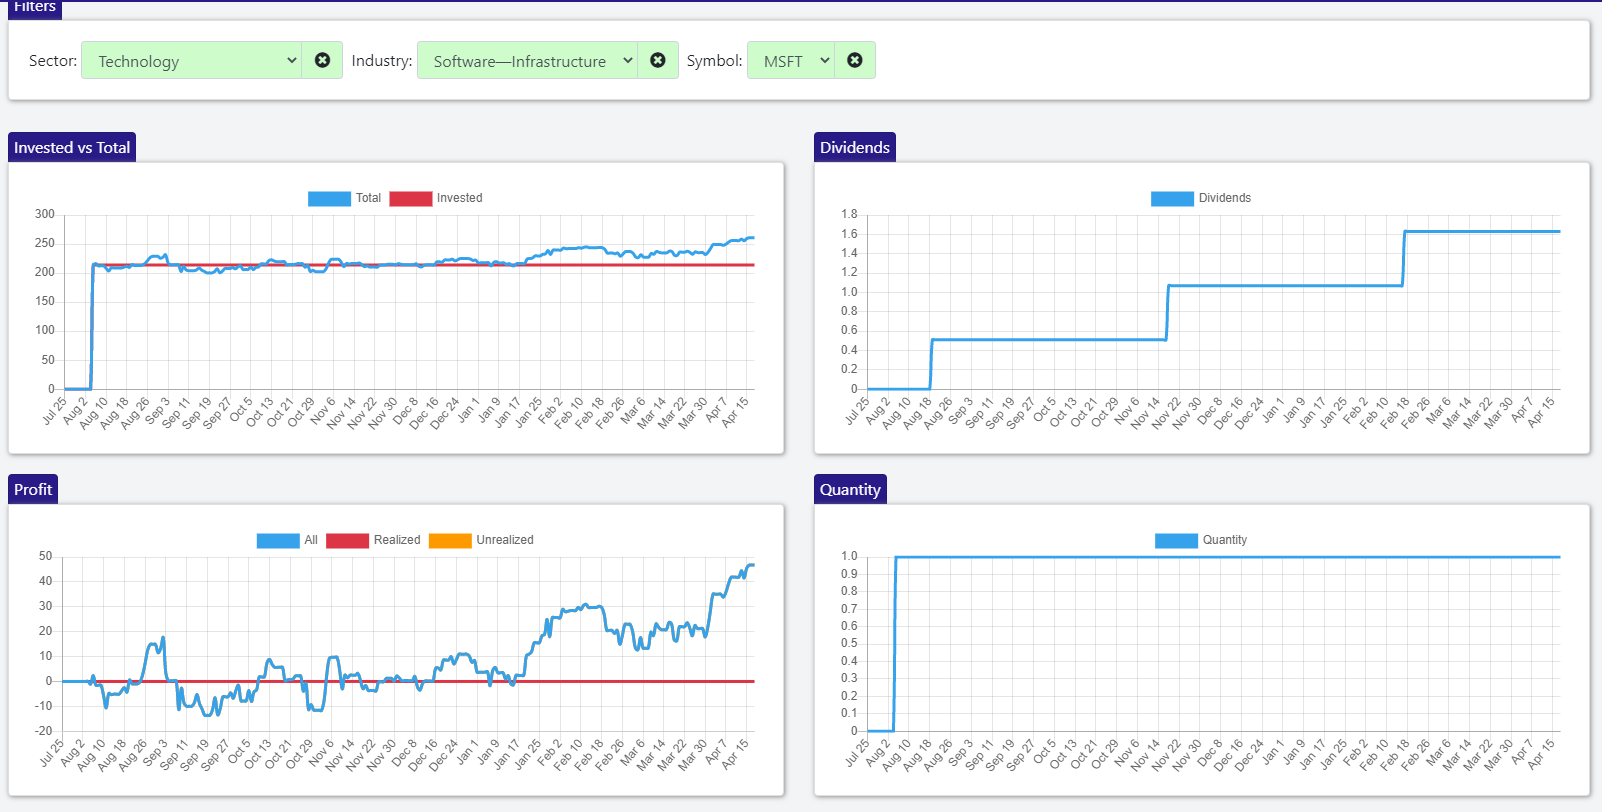
Turns out that the only company we invested in as part of the Software-Infrastructure industry is Microsoft (MSFT). For an entire half of a year (August - January) the return from it stayed close to zero. On the other hand, we can see that lately it started to catch an upwards momentum. So maybe this is not the right moment to sell.
Let's jump to the Semiconductors industry to understand the situation there
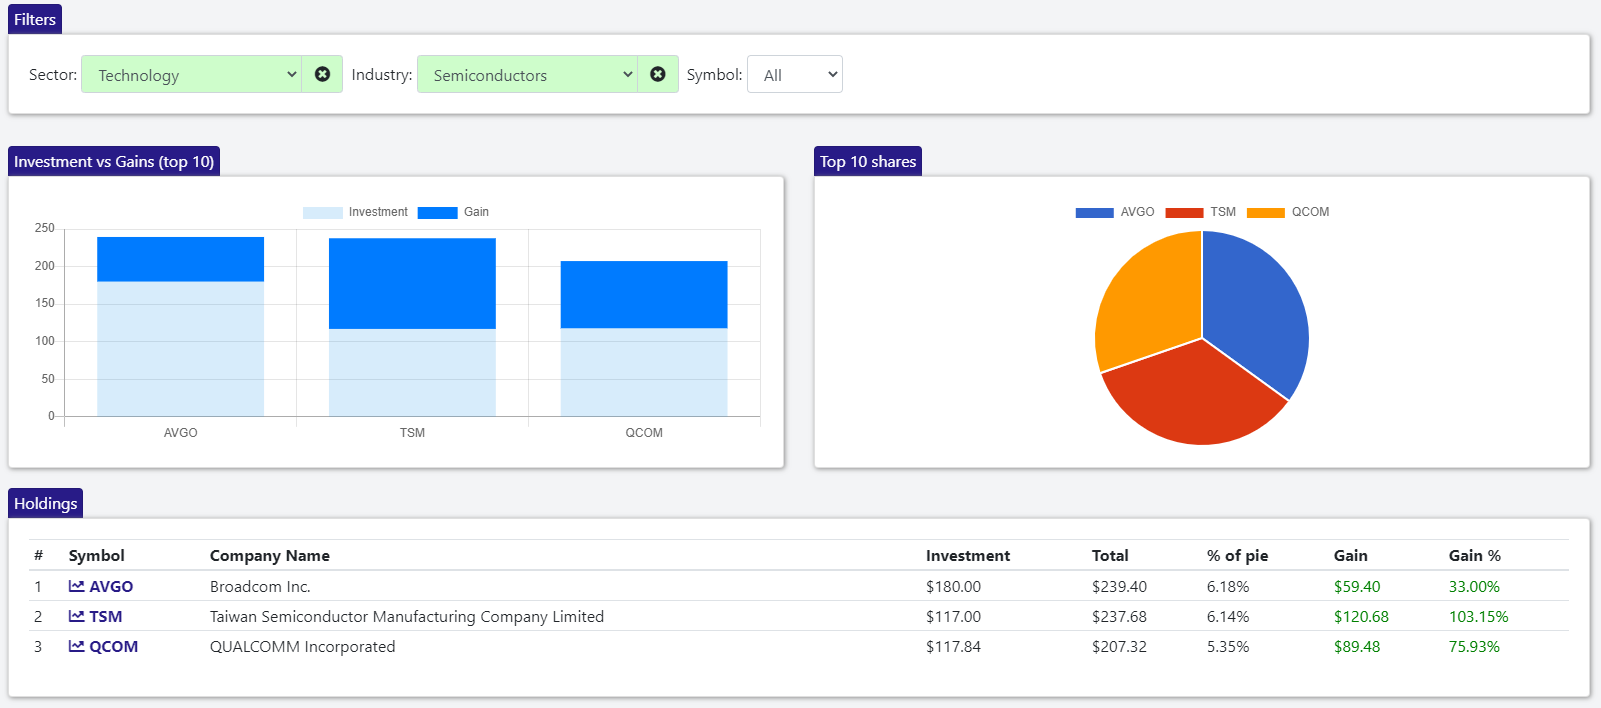
In this industry, we can see that we currently have around 1/3 of investments in each of the three companies (Broadcom, TSMC and Qualcomm). But we can also see that although the holdings in AVGO and TSM are similar in size, we invested a lot less in TSM
So TSM seems to be performing way better, which is actually confirmed by the Gain% in the bottom table (101% gain in TSM vs 33% in AVGO). This makes sense given the near monopoly TSM has in semiconductor foundries
Let's understand how TSM performed over time
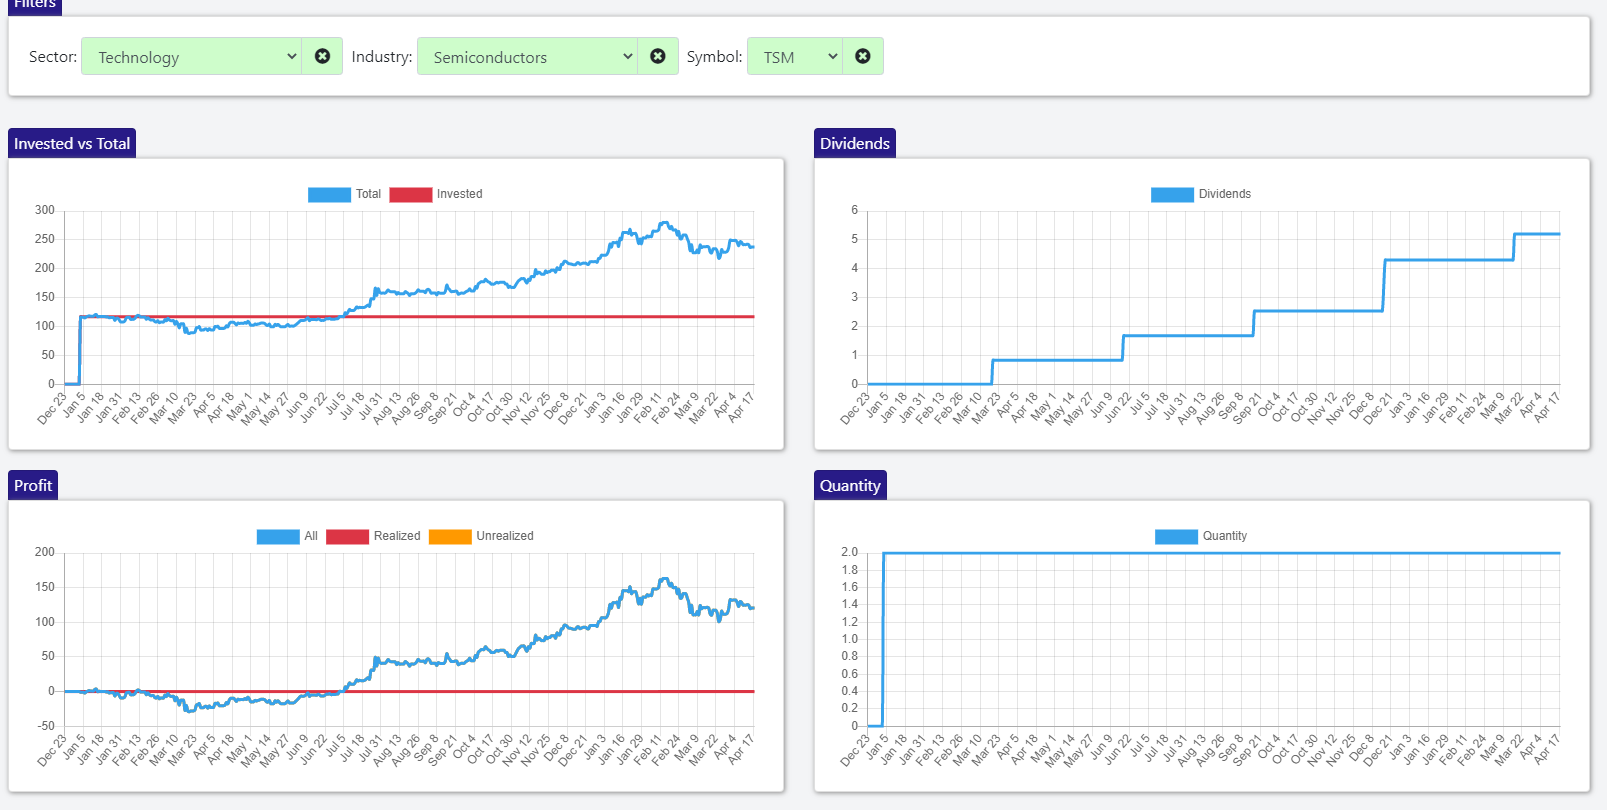
Looks like TSM pays a nice dividend, it also grew a lot over time and continues it growth trajectory. So if we want to downsize our position in Semiconductors, it might be a good idea to sell some of the AVGO shares and keep TSM for now
But before selling, let's better understand AVGO. For this, we will use the ticker page
News, Financial Data and Fundamentals
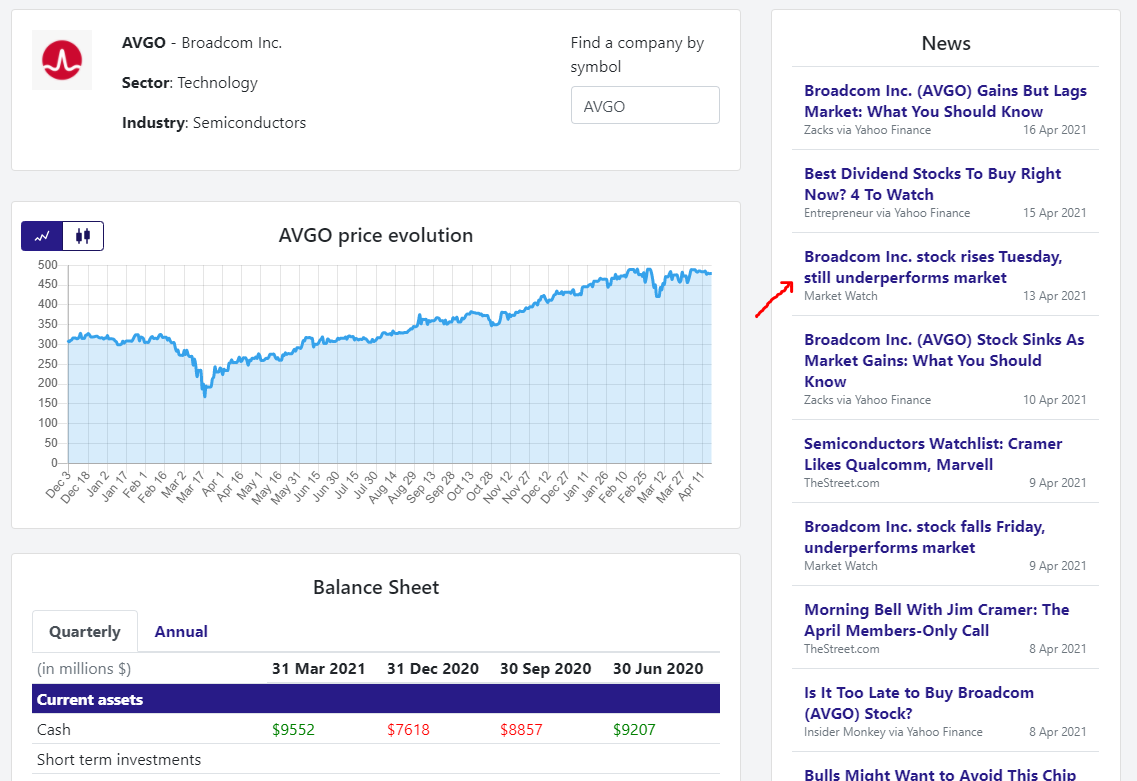
Let's start by reading the latest news for the company in the News section. We can see that Market Watch also reported that the stock underperforms the market
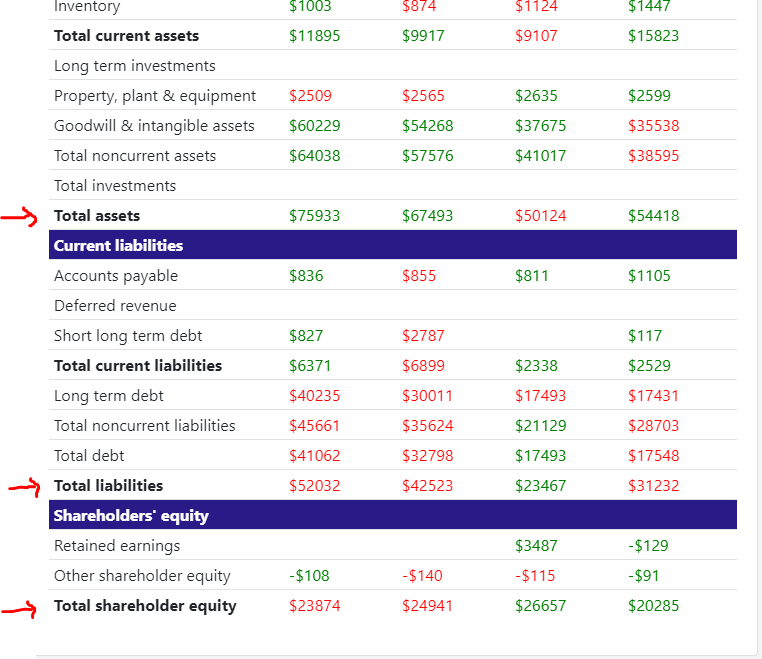
We can also see that while their assets grew in the past few years, their liabilities grew faster, thus the shareholder equity decreased
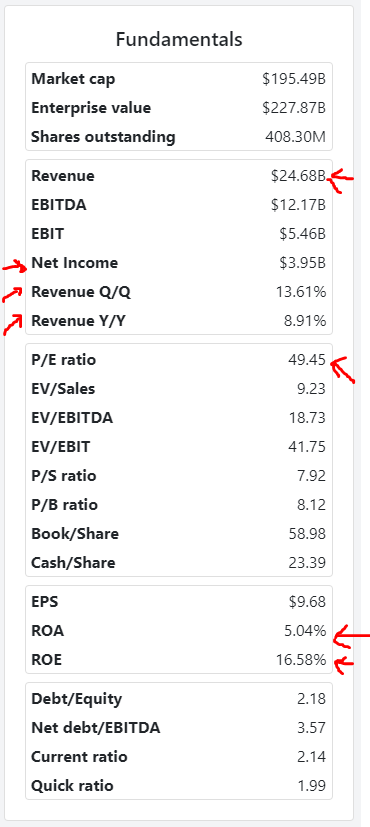
By analyzing their fundamentals, we can see that their P/E ratio is relatively high at 49.5 and that their revenue increased both quarter/quarter and year/year, but the increase is below that of their competitors.
Based on the data, we decide to sell AVGO and use the gains to reopen a position in companies from the Financial Services sector which we previously liquidated (as can be seen in the graph). This way, we increase our diversification and we also take advantage of the momentum the companies in the Financials sector have at this moment