Take control of your investments
Statfolio is the best stock and ETF portfolio tracker. Leverage our powerful analytics to visualize the performance of your investments.
Try our demo Learn more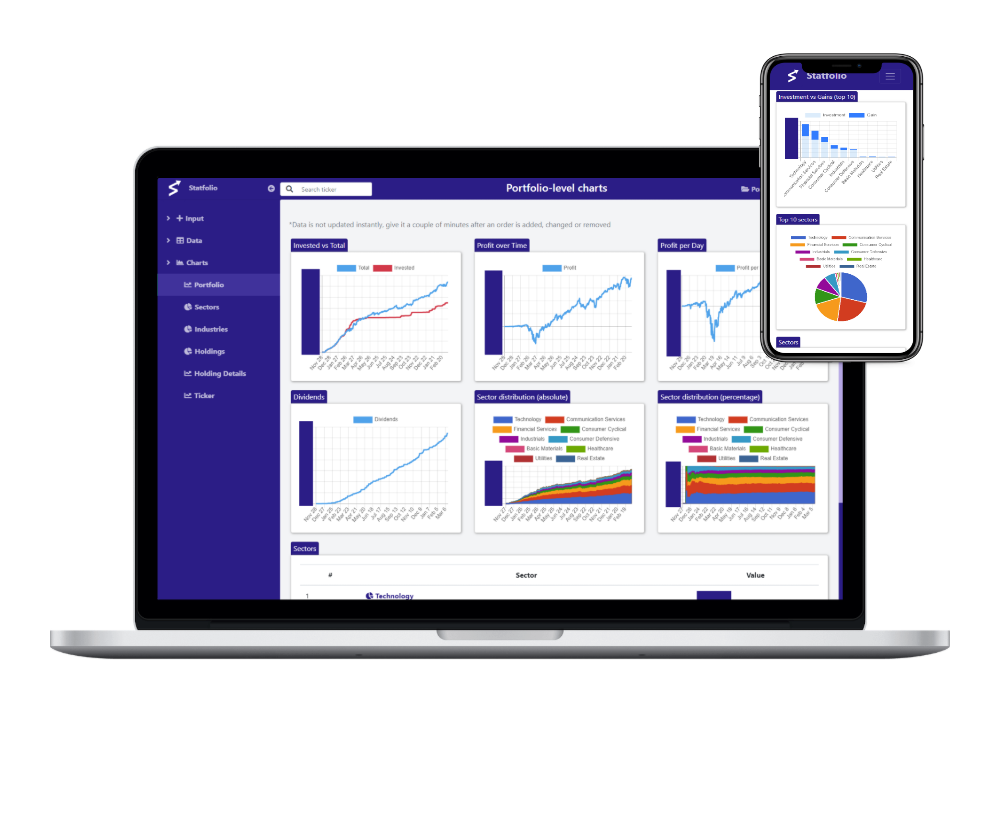
Automatic aggregation
You enter your orders manually or import them and we do the rest. Some of the useful reports you are getting:
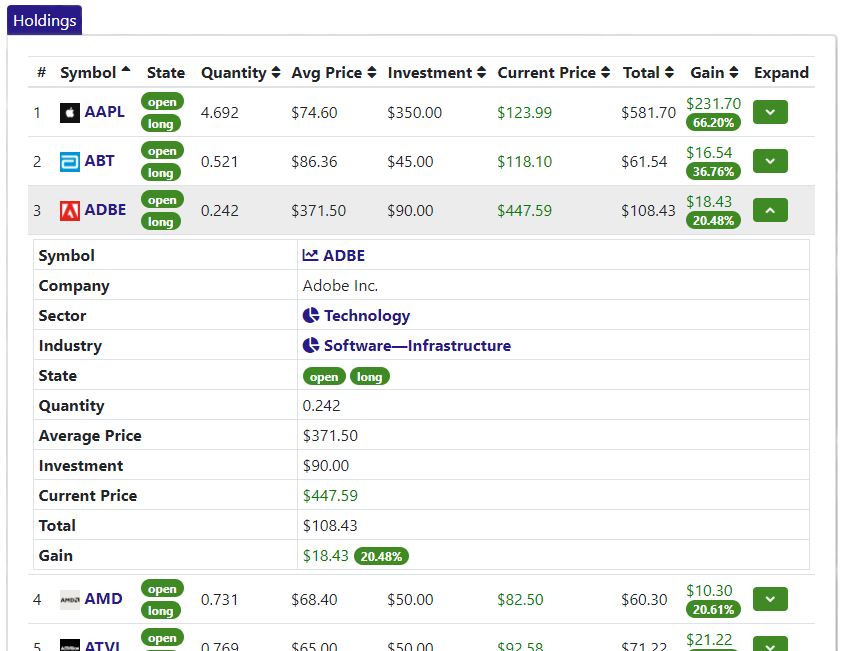
- Current holdings - see how each holding is performing, we support both long and short positions.
- Breakdown at sector, industry, holding and order level - understand how each component contributes to the overall performance.
- Time based charts - you don't just understand the current situation, but also how you performed historically.
Powerful analytics
Take control of your investments:
- Identify underperforming holdings
- Spot sector rotations early on
- Understand your diversification
- Daily updates for price and dividends
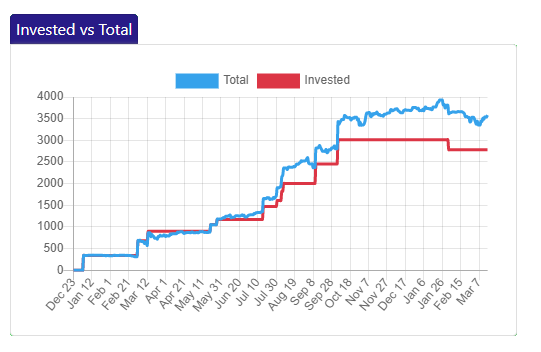
The cost of buying the stocks vs how much it grew over time for a portfolio or invidiual holding
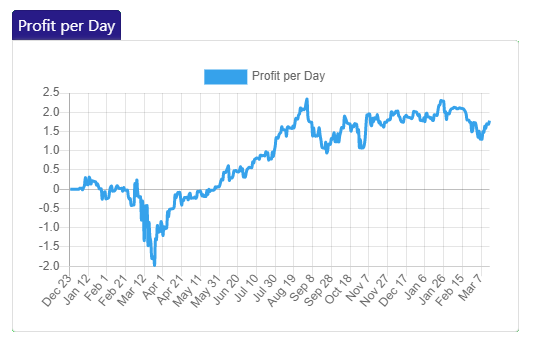
The total profit devided by the number of days since the first investment in the portfolio
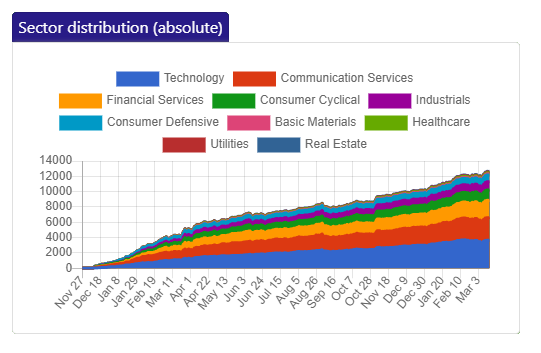
How much each sector contributes to the portfolio (in dollar value)
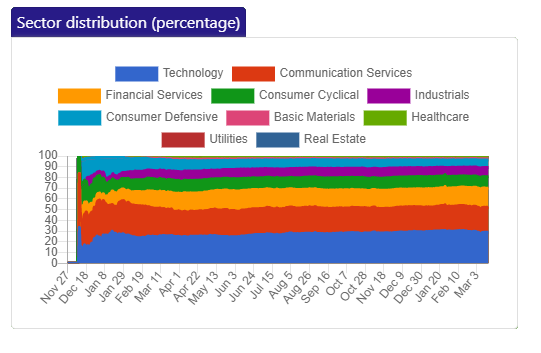
How much each sector contributes to the portfolio (in percentages)
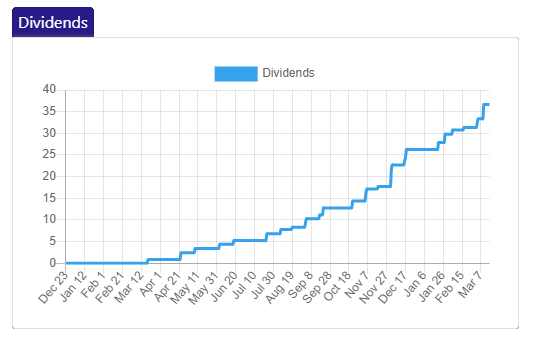
The cumulative dividends received for a portfolio or single holding
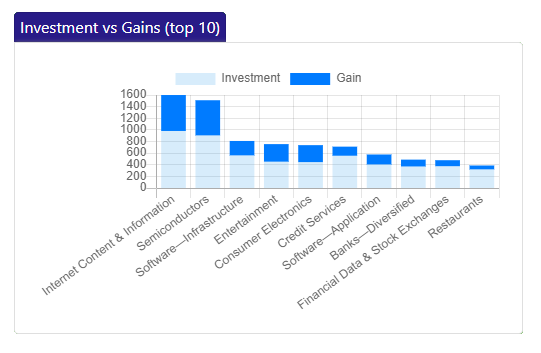
How much was invested in each industry + the profit/loss
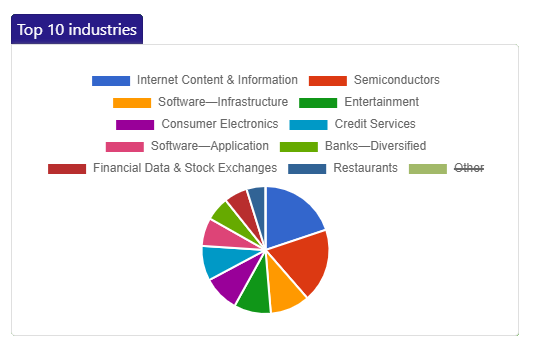
Which are the top industries in the portfolio or in the selected sector
Insightful segmentations
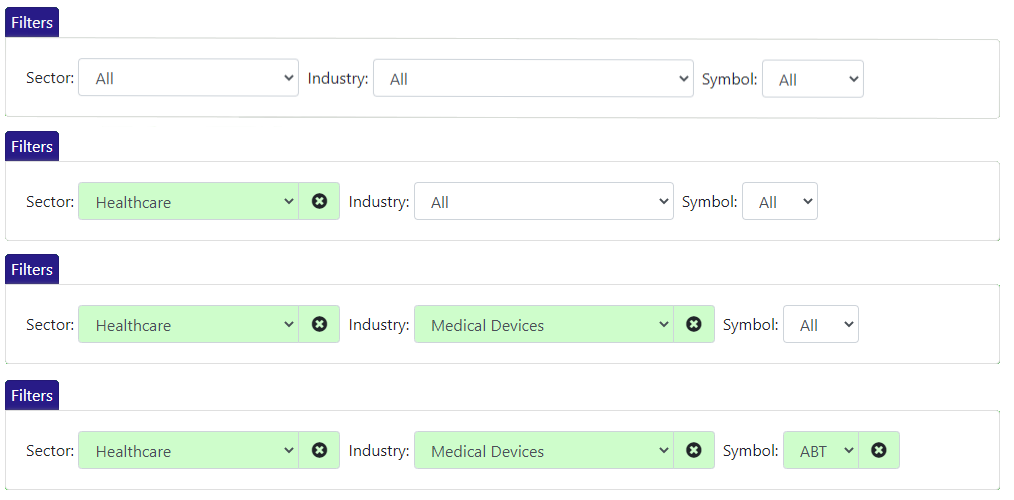
You can analyze the data at multiple levels:
- Portfolio level - see all the sectors/industries/holdings in your portfolio and how much each contributes
- Sector level - understand the industries in a specific sector
- Industry level - understand the holdings in a specific industry
- Holding level - analyze a single holding and see how it evolved over time and how much dividends you gained from it
Get started today
Get started for free with a single portfolio and up to 50 orders
Choose one of the paid plans for higher limits and better support
Try our demo account and see the power of visualization for yourself
FAQ
- Understand how your portfolio performed over time
- Understand the diversification of your investments
- Identity which sectors or industries are performing well and which are not
- See how each holding evolved over time and the top performing investments
- Research new investment opportunities
- Stay up to date with the financial news
You can track stocks from the following exchanges:
- NASDAQ - Nasdaq Stock Exchange, including all sub-exchanges (e.g. NASDAQ-CM, NASDAQ-GM, NASDAQ-GS)
- NYSE - New York Stock Exchange, including all sub-exchanges (e.g. NYSE Arca)
- BATS - Cboe's Bats Global Markets
- LSE - London Stock Exchange
- XETRA - Deutsche Börse
- FRA - Börse Frankfurt
- PAR - Euronext Paris
- TSX - Toronto Stock Exchange
- TSXV - TSX Venture Exchange
- ASX - Australian Securities Exchange
- NSE - National Stock Exchange of India
- OTC - Over-the-counter stocks (only on demand)
Some brokers may indeed offer some of our features, but they usually give you only limited visibility. For them, tracking your portfolio is only a side feature. Brokers have the incentive to determine you to make more transactions.
Statfolio is not in the brokerage business, so our main objective is to help you understand your investments better, even if that means making fewer transactions. In addition to that, with Statfolio you can track the portfolios from multiple brokers
- USD
- EUR
- GBP
- CAD
- AUD
- INR
You start by creating a portfolio and adding orders in it. We then aggregate those orders into holdings for each company you invested in. These holdings are then aggregated into industries, then into sectors and finaly at portfolio-level. Each aggregation step produces a report for that granularity, so you will be able to analyze your investments at the level of the entire portfolio, a sector, an industry, an individual holding or even for each separate order.
Check our Getting Started guide to find out more.
All you need to get started is an email address. After you sign up, you create a portfolio and then you can add a few orders for testing purposes. Don't worry, these test orders can be removed later on.
After you added the orders, in a few seconds the system will start aggregating those orders and compute all the charts. You can navigate to the menu items under the "Visualize" section to see them.
Check our Getting Started guide to find out more.
Simply add your buy or sell transactions - Statfolio will automatically record any dividends, share splits or other changes caused by corporate actions.