Getting Started with Statfolio
Table of Contents
- What is Statfolio?
- How to get started with Statfolio?
- Creating a portfolio
- Adding Orders
- What is a holding
- Checking the current holdings
- Portfolio-level charts
- Sector-level charts
- Industry-level charts
- Holding-level charts
- Drill-down into an individual holding
- Conclusion
What is Statfolio?
Statfolio is a portfolio tracker focused on analytics and visualization. It can answer some important questions like: how did my investments perform over the past year? is my portfolio diversified enough? What is happening with some individual sectors/industries of my investments right now?
How to get started with Statfolio?
First thing is to understand the concepts. The site is structured into 3 sections:
- Data - the raw and aggregated data. Here you can see the portfolio and orders you've created, but also the holdings (all the orders for a company) Statfolio automatically aggregates and the dividends you received under the portfolio. You also come here to add new data (portfolios or orders).
- Visualize - the fun part where you can visualize different metrics for your portfolio. You can see metrics at portfolio, sector, industry or holding level
- Research - this is where you can understand the current state of the market, discover potential new investment opportunities and study company data (financials, news, fundamentals etc)
Creating a portfolio
After creating a new account, the first thing to do is to create a new portfolio. A portfolio is just a way to group together multiple investments. A good rule of thumb is to create a portfolio for each brokerage account. A portfolio just requires a name (e.g. Robinhood)
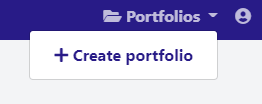
Go ahead and give it a name and press Create
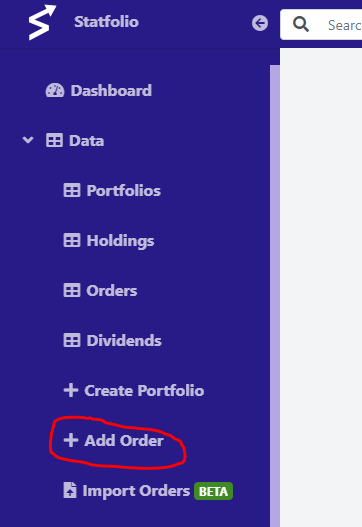
Adding Orders
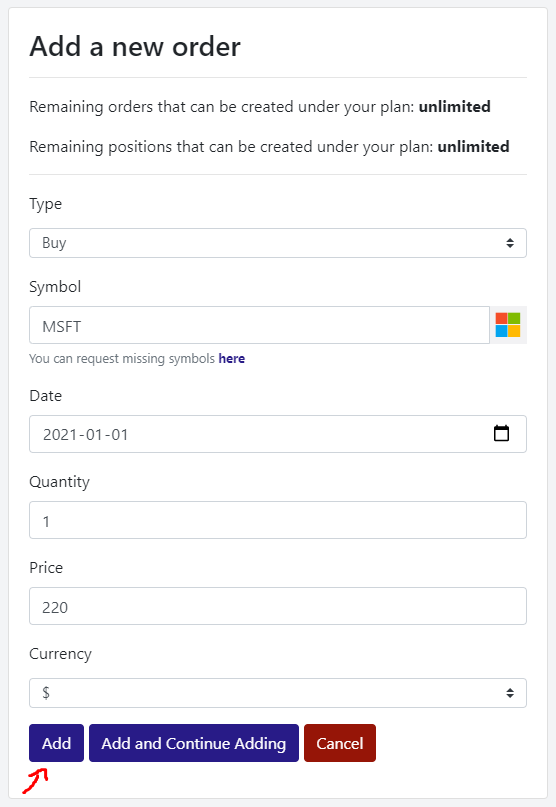
Now that you have a portfolio, the next step is to start adding orders. To add an order, navigate to Data -> Add Order:
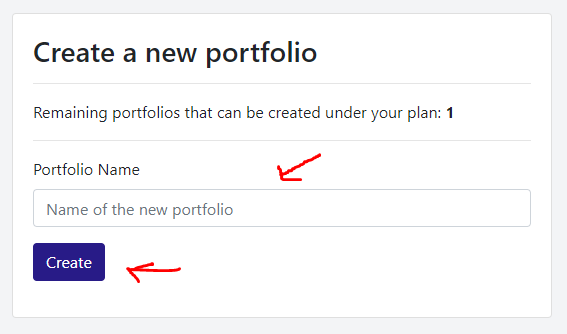
Complete all the required data. Choose the order type (either a buy or a sell), the symbol (e.g. MSFT), the date when the order was executed, the number of shares (can be a fractional number), the price at the moment when the order was executed and the currency used. After all the data is added, the form should look like below. Go ahead and press Add
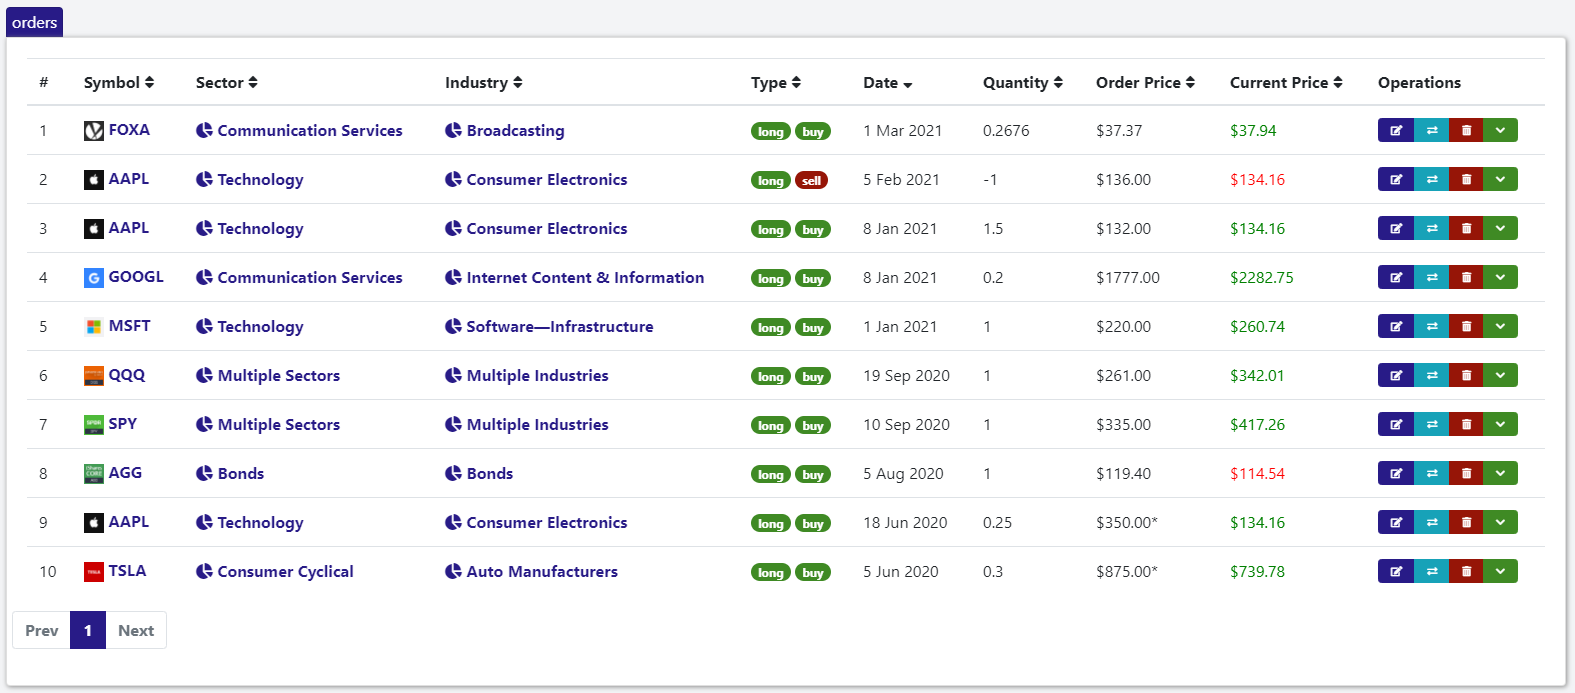
After adding multiple orders, if you navigate to Data -> Orders you should seed all of them in a table:
What is a holding?
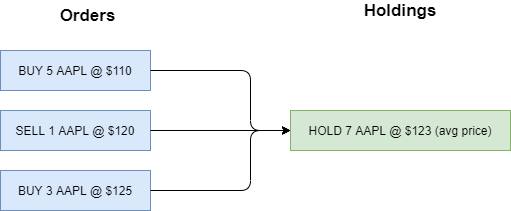
A holding or position is the aggregated quantity of a security you owned. If for example AAPL was bought multiple times over time, the sum of all the bought quantities represents the current AAPL holding
Checking the current holdings
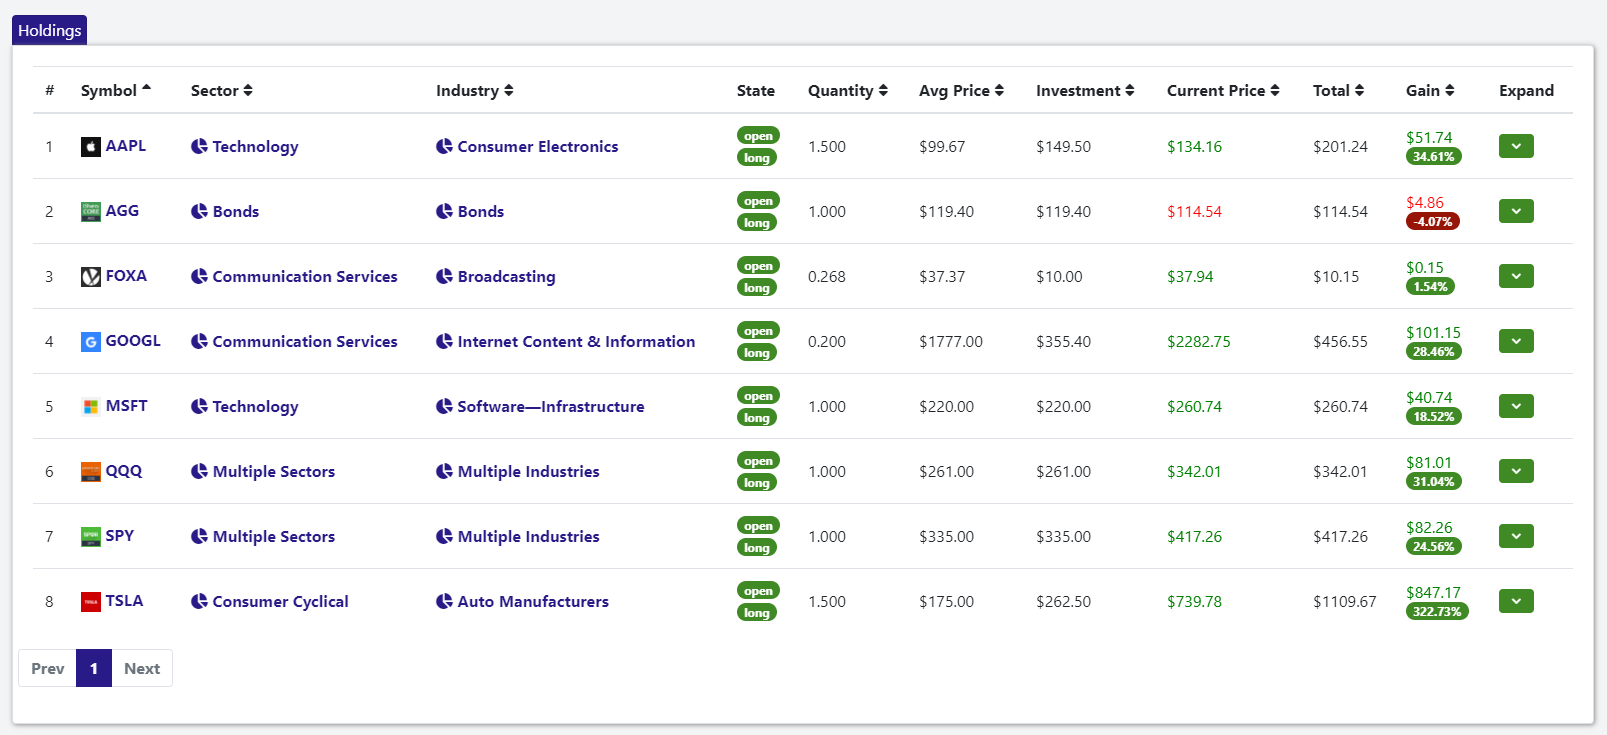
In order to see the current holdings, navigate to Data -> Holdings in the menu. Notice how the three AAPL orders are aggregated into a single holding
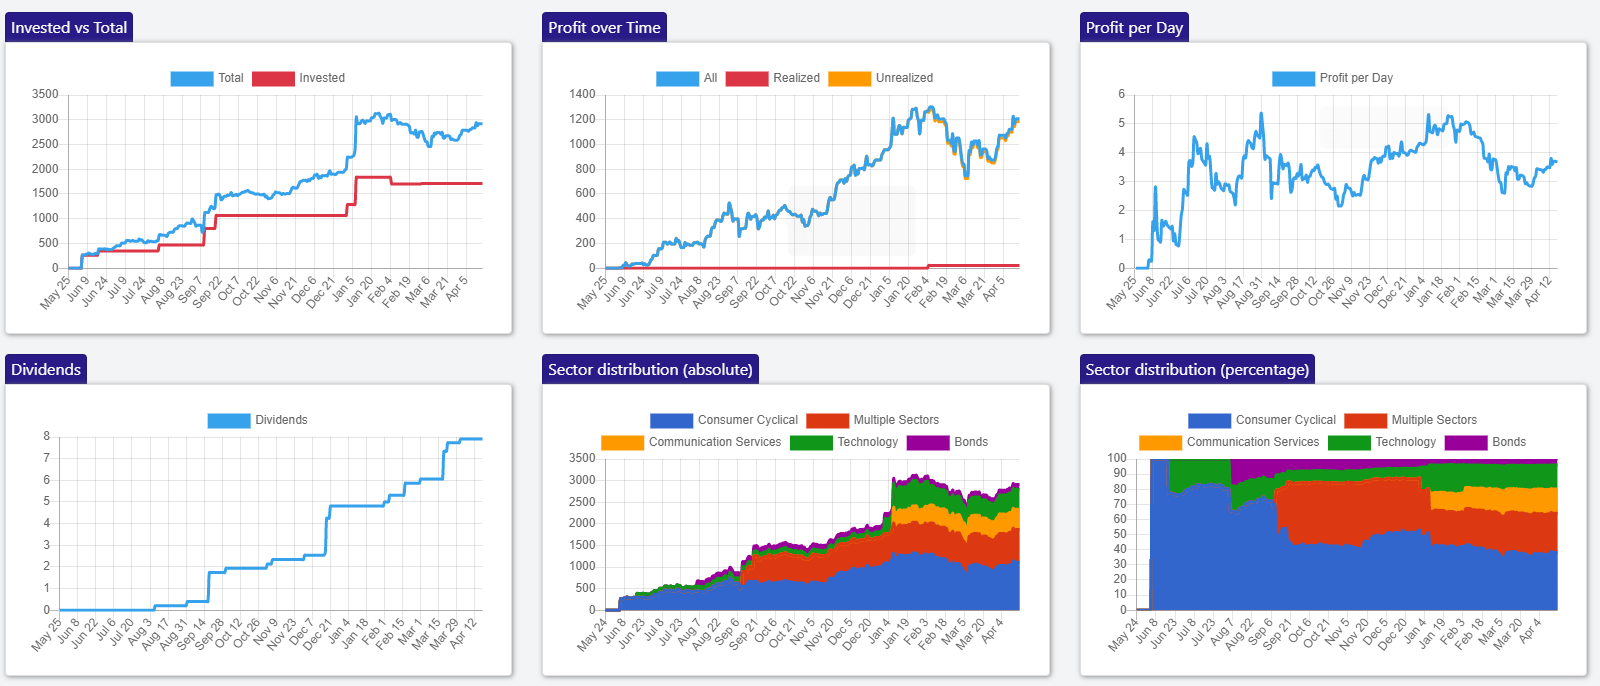
Portfolio-level charts
To access these charts, navigate to Visualize -> Portfolio
These charts can be used as an overview of the portfolio situation. You can see how much was invested, how much the portfolio is worth now, the realized and unrealized profit, profit per day, how much was payed in dividends, how much each sector contributes to the total etc.
For the example portfolio with the holdings shown above, the charts look like this
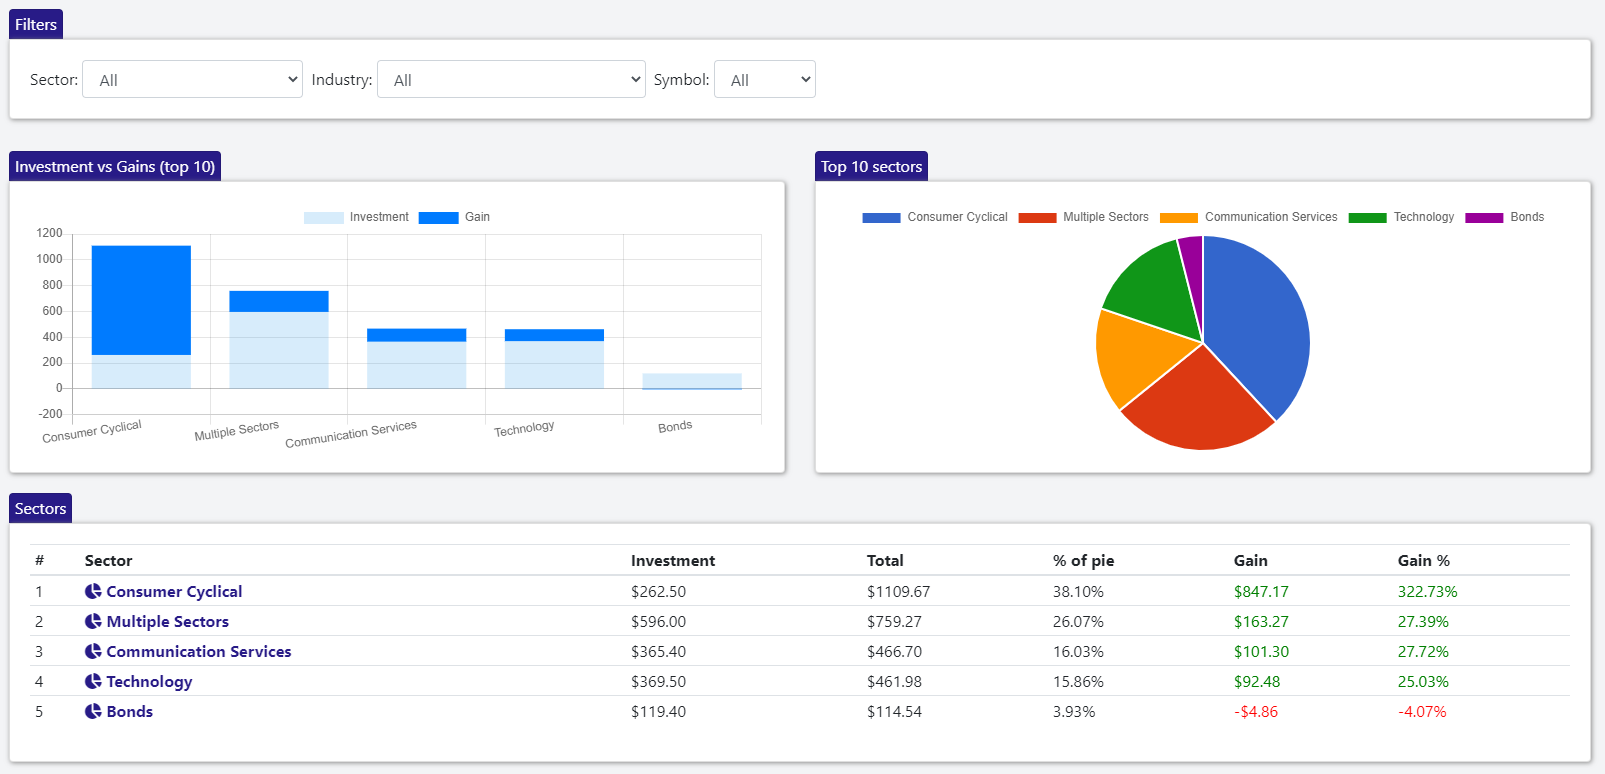
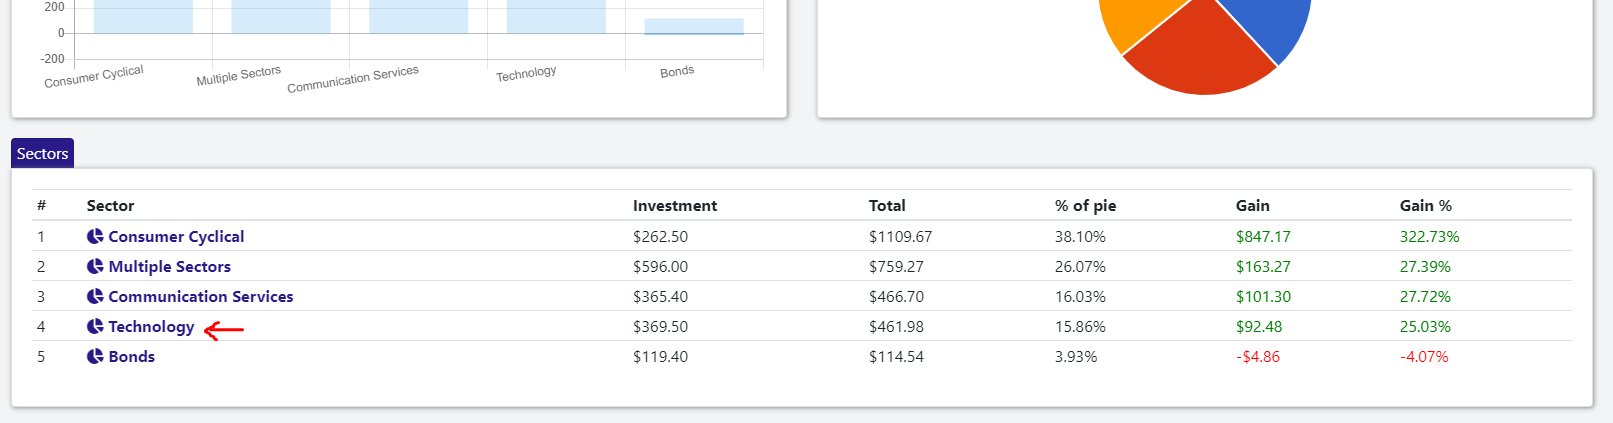
Sector-level charts
To access these charts, navigate to Visualize -> Sectors
These charts present the situation at sector level. How much each sector represents from the total, how much was invested vs gained etc
For the example portfolio with the holdings shown above, the charts look like this
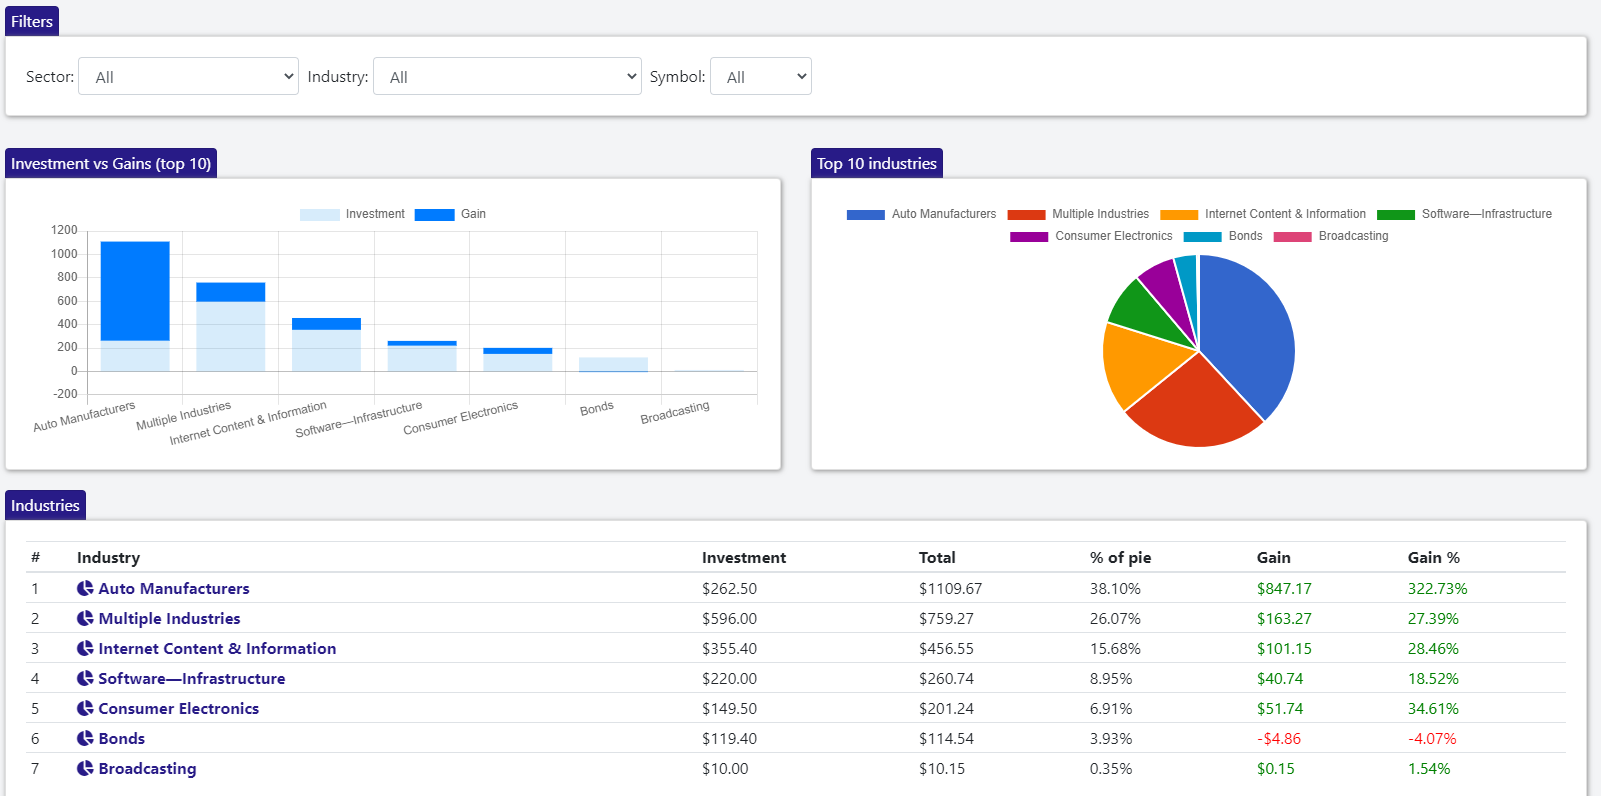
Industry-level charts
To access these charts, navigate to Visualize -> Industries
These charts present the situation at industry level. How much each industry represents from the total, how much was invested vs gained etc
For the example portfolio with the holdings shown above, the charts look like this
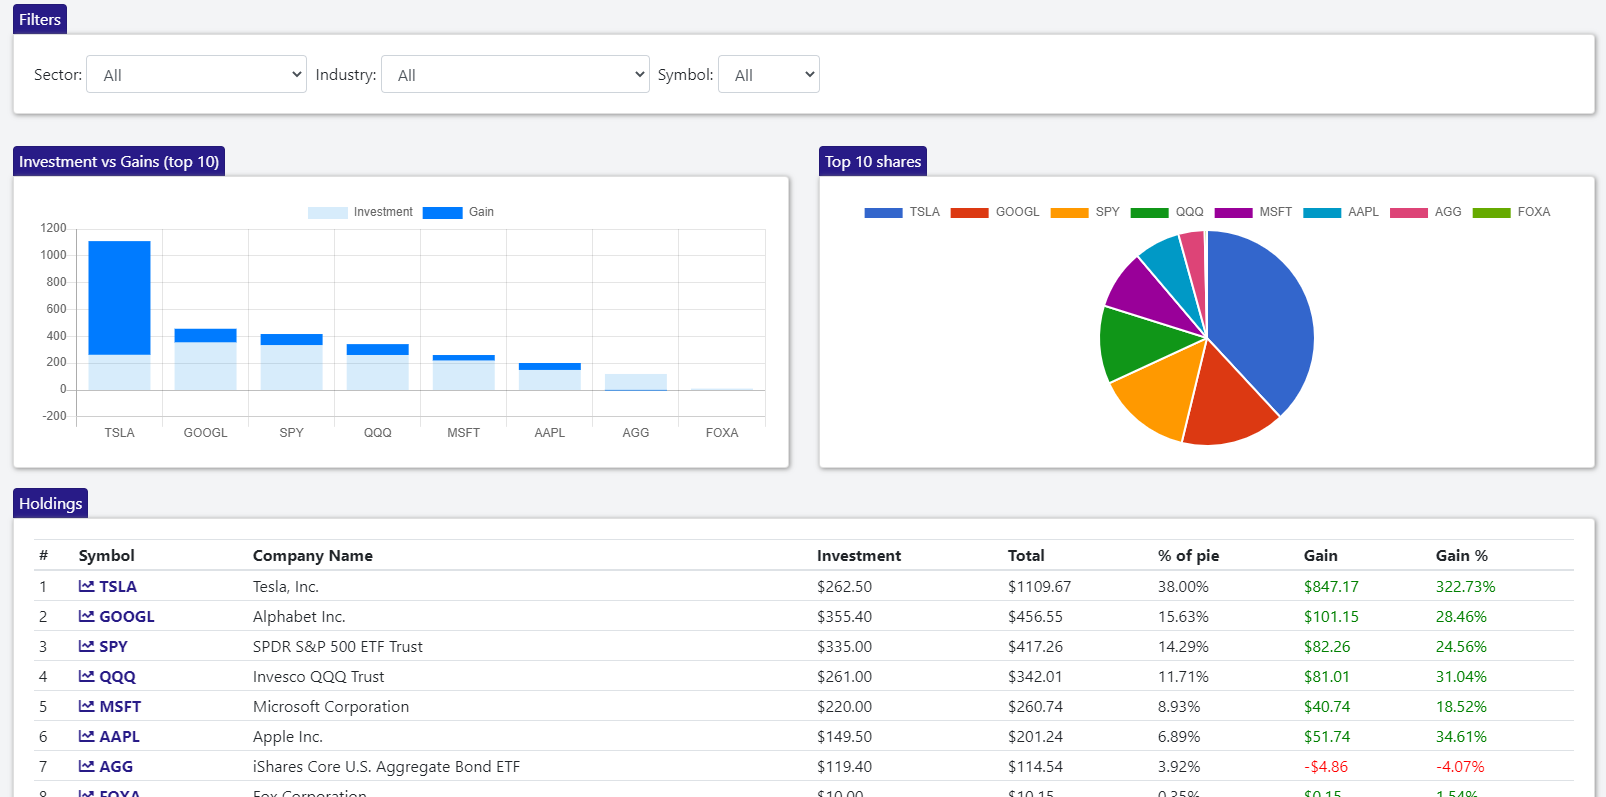
Holding-level charts
To access these charts, navigate to Visualize -> Holdings
These charts present the situation at holding level. How much each holding represents from the total, how much was invested vs gained etc
For the example portfolio with the holdings shown above, the charts look like this
Drill-down into an individual holding
One of the most powerfull features of Statfolio is its drill down capabilities. Starting at portfolio level, you can drill down into an individual sector, then an industry in that sector, then a holding in that industry
To do so, start from the sector-level charts and click one of the sectors in the table (e.g Technology). You can also select the sector from the drop-down in the filters section at the top of the page.
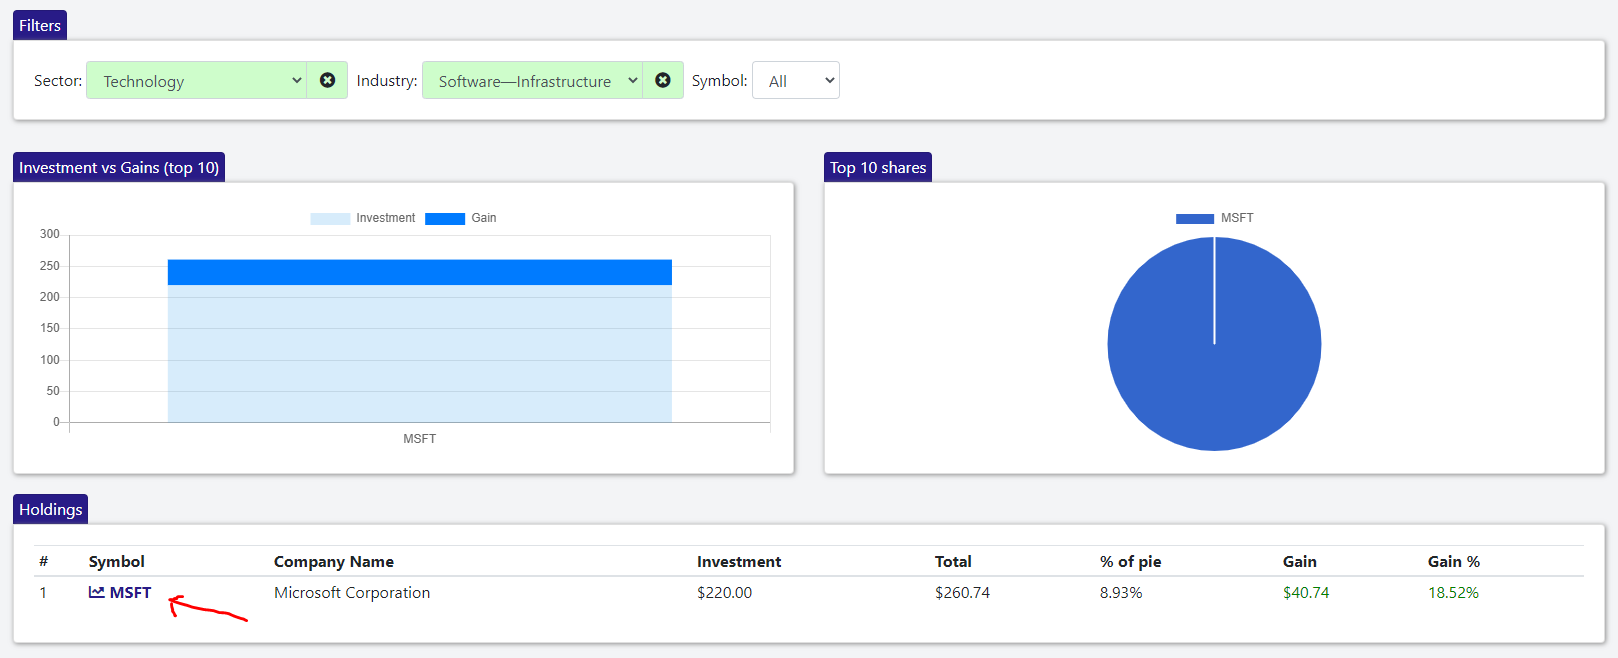
Now, only the industries in the Technology sectors are shown. Let's further drill down into the Software-Infrastrcture industry by clicking it in the table.

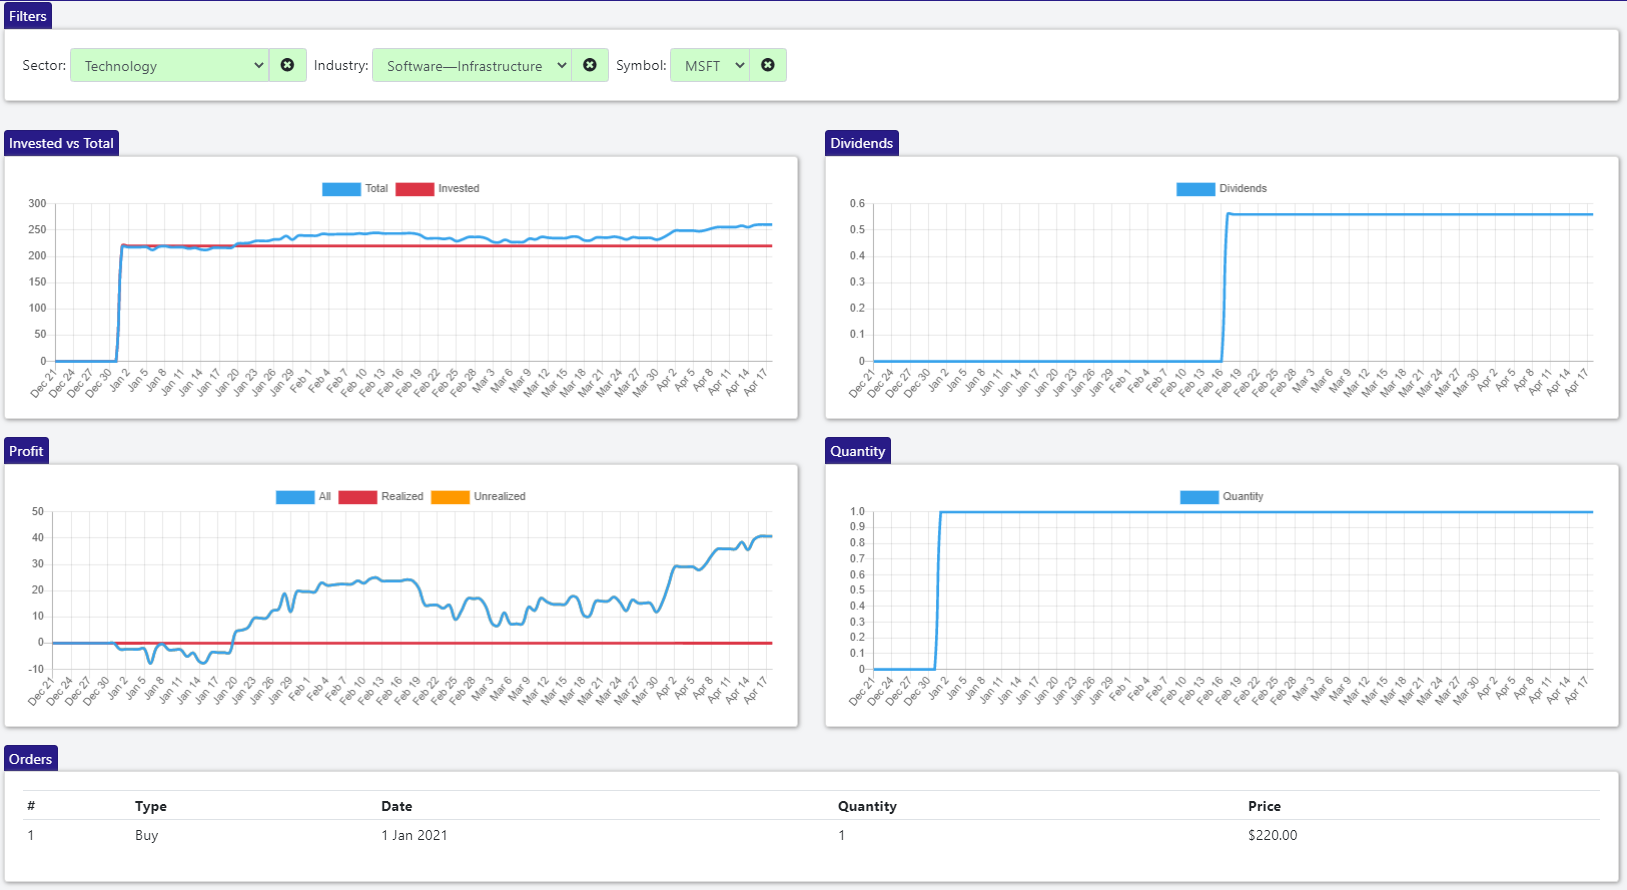
In this portfolio, I only invested in a single company from the Software Infrastructure industry, which is MSFT (Microsoft). Let's see how my holding in Microsoft performed over time by clicking MSFT in the table.
Here, you can undestand how the investment in MSFT performed over time, how much was invested, how much it is worth now, the dividends it payed, the realized and unrealized profit and the quantity we owned at each moment in time
At the bottom, a list of orders is shown. In this case, we only bought MSFT a single time, on Jan 1st 2021
Conclusion
This article only scratches the surface of what Statfolio can offer. Besides the powerful visulization, Statfolio also offers daily relevant news for each symbol, financial data, fundamental analysis, dividends etc.
Don't take our word for it, sign up to our free plan or try our demo to see for yourself