Torsten Asmus/iStock via Getty Images
Investment Thesis
The Goldman Sachs Equal Weight U.S. Large Cap Equity ETF (BATS:GSEW) is the second-cheapest equal-weight large-cap blend ETF on the market. Therefore, it should be considered an alternative to more established funds like the Invesco S&P 500 Equal Weight ETF (RSP). However, my analysis finds that GSEW has underperformed RSP and several other equal-weight alternatives since its inception. Furthermore, its fundamentals aren't impressive, indicating no basis for a buy rating. This article discusses those fundamentals in more detail and highlights 30 other equal-weight alternatives for your consideration.
GSEW Overview
Strategy Discussion
Goldman Sachs lists three reasons to invest in GSEW: avoidance of market cap bias, systematic monthly rebalancing, and a low 0.09% expense ratio, second only to the SPDR S&P 500 High Dividend ETF (SPYD).
Goldman Sachs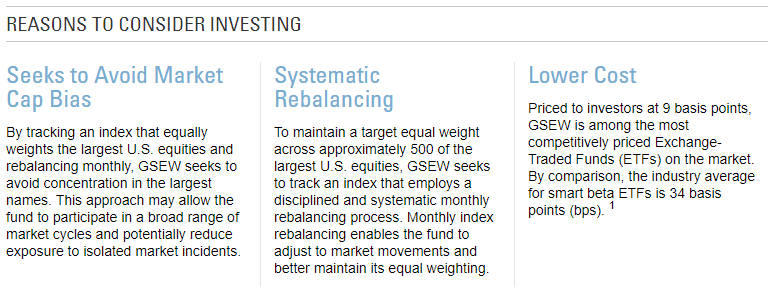
Low fees and alternate weighting schemes aren't new, but monthly rebalancings are. Individuals attempting this would generate an unwanted number of taxable events, but the ETF structure allows firms to do so without tax consequences. The critical question is if it works, which I'll address shortly.
GSEW tracks the Solactive US Large Cap Equal Weight Index. In its Investment Solution Presentation, Goldman Sachs highlights how Solactive selects the 500 largest U.S. companies by free-float market cap as opposed to RSP, whose S&P Index is discretionary. Goldman Sachs argues that the Solactive Index provides a better real-time reflection of the U.S. economy and has a higher growth profile than the S&P Index.
Goldman Sachs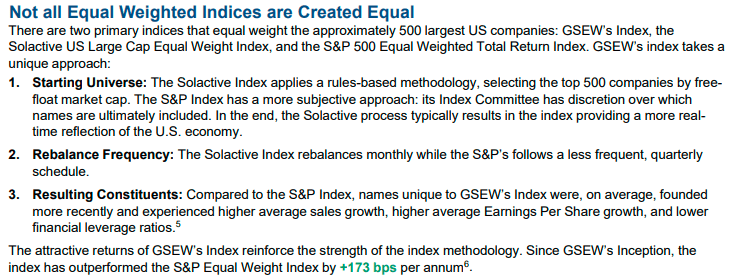
Finally, Goldman Sachs notes that since GSEW's inception, it's outperformed the S&P Equal Weight Index by 1.73% per year. However, the footnote indicates the performance period is from September 2017 to August 2020. GSEW's fund page highlights a less-impressive picture through December 31, 2022. The Index underperformed the S&P 500 over the last one, three, and five-year periods by an annualized 0.78%, 1.16%, and 1.47%.
Goldman Sachs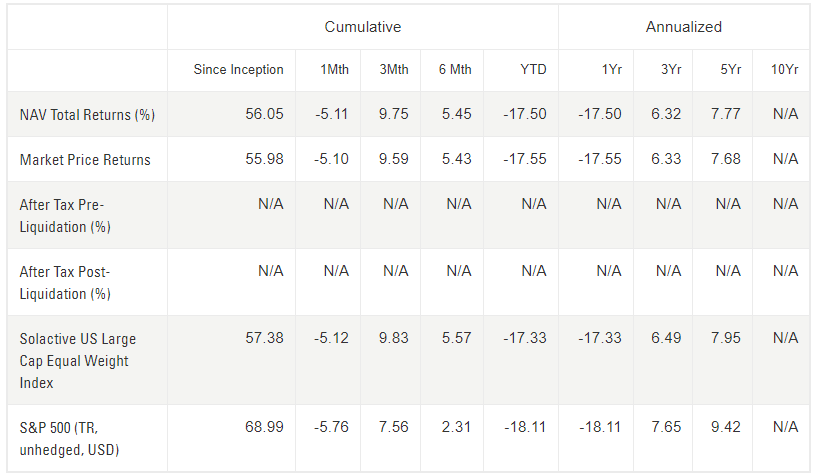
Performance
Portfolio Visualizer's backtesting tool extends the performance analysis through February 1, 2023. These results, which include fees, show how GSEW also underperformed RSP by an annualized 1.28% since October 2017. Volatility was slightly lower, and GSEW had a lower maximum drawdown. GSEW's 24.77% drawdown was from January - September 2022, while RSP's 26.65% decline was from January - March 2020.
Portfolio Visualizer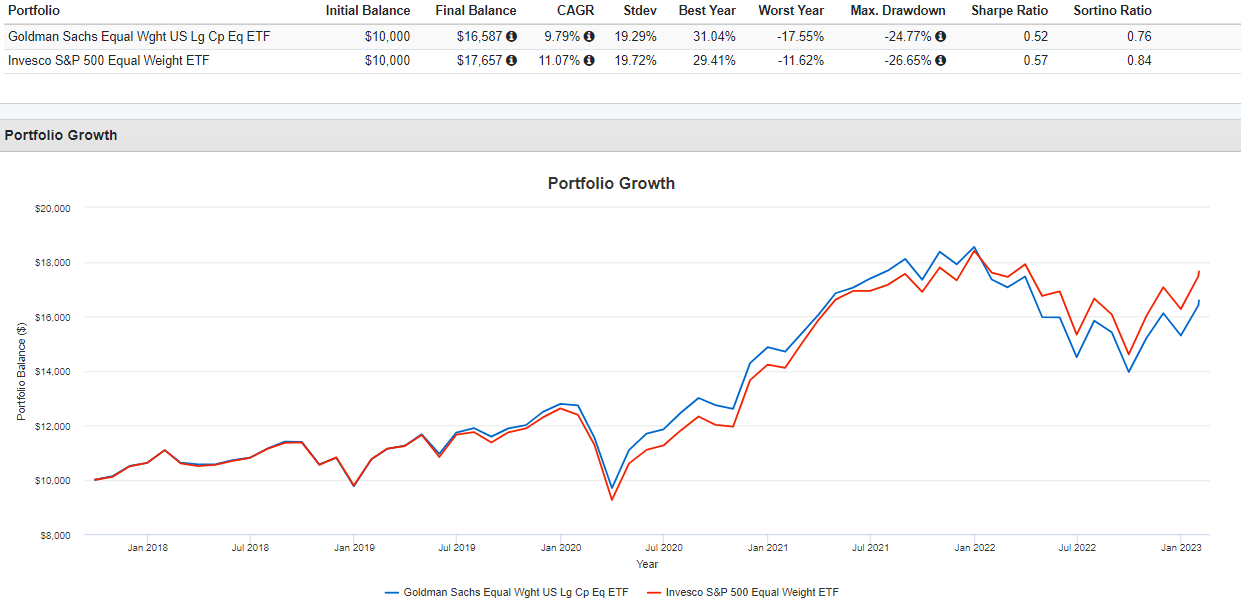
There are 31 equal-weight large-cap ETFs on the market, classified as follows:
- High Dividends: 3
- Large-Cap Dividends: 4
- Large-Cap Blend: 18
- Large-Cap Growth: 2
- Momentum: 2
- Low Volatility: 1
- Impact Investing: 1
I noted the category for each ETF below and their periodic 1-10Y returns through January 2023 in the following table. The table is sorted by five-year returns, matching GSEW's approximate inception date.
The Sunday Investor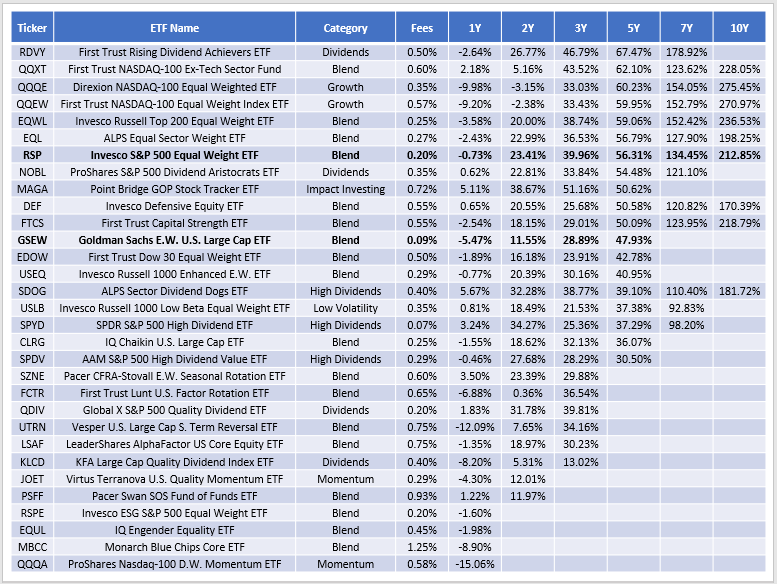
GSEW's 28.89% and 47.93% three- and five-year returns ranks #12/19 and #19/25 for those with enough history. Furthermore, its 5.47% loss over the last year was eighth-worse among all 31 peers. Several other large-cap blend ETFs have better track records, including RSP. The Invesco Russell Top 100 Equal Weight ETF (EQWL) and the ALPS Equal Sector Weight ETF (EQL) are two examples with reasonable fees. RDVY, QQQE, and QQEW are options for investors wanting more exposure to Technology stocks, while QQXT is available for those wishing to avoid the sector. In short, I find GSEW's track record isn't impressive. Let's next discuss potential reasons why.
GSEW Analysis
Exposure Differences With RSP
GSEW holds 62 companies not in RSP for an approximate 12.60% total weight. The most significant additions are in Systems Software stocks like Palo Alto Networks (PANW) and Application Software stocks like Zoom Video Communications (ZM). Deletions include Consumer Discretionary stocks like Wynn Resorts (WYNN) and CarMax (KMX). Sector exposure differences for RSP, GSEW, and the SPDR S&P 500 ETF (SPY) are below. GSEW's superior growth profile is demonstrated by its higher exposure to Technology stocks. Consumer Discretionary is the central offset.
Morningstar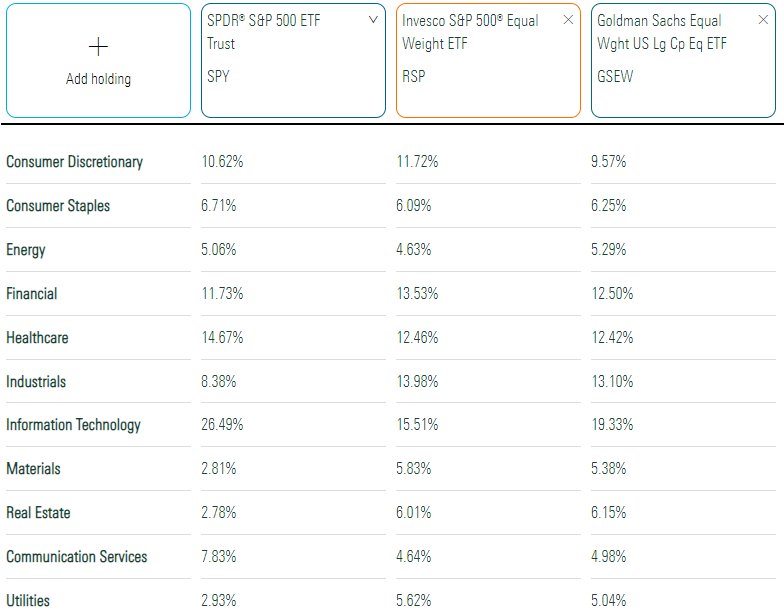
This month's rebalancing should take Technology exposure down to about 18.50%, as it's not reflected in Morningstar's figures yet. This feature is effectively anti-momentum, selling shares of high-performing stocks while buying up poor performers. State Street's Sector Tracker notes how large-cap Technology stocks gained 11.83% over the last month as investors shifted away from defensive sectors like Consumer Staples, Health Care, and Utilities.
State Street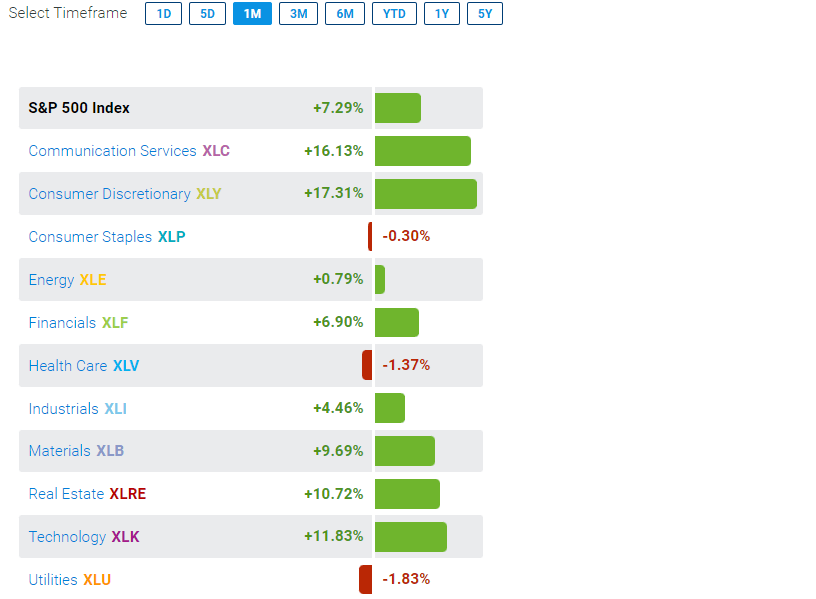
The monthly rebalancing strategy is just as arbitrary as S&P's quarterly one. Furthermore, stocks influencing markets the most (Apple (AAPL), Microsoft (MSFT), Alphabet (GOOG) (GOOGL), Amazon (AMZN), Exxon Mobil (XOM), Visa (V)) report close to month end. GSEW's rebalancing schedule takes a lot of earnings risk out of the equation but limits potential rewards. Since markets generally go up over the long run, it's a key reason for GSEW's underperformance.
Fundamentals vs. RSP
GSEW's track record could be better, but let's look at its fundamentals next to see if there's a buying opportunity. The following table highlights selected metrics for GSEW's top 25 industries, showcasing the higher growth profile mentioned previously. However, that also comes with a higher price tag.
The Sunday Investor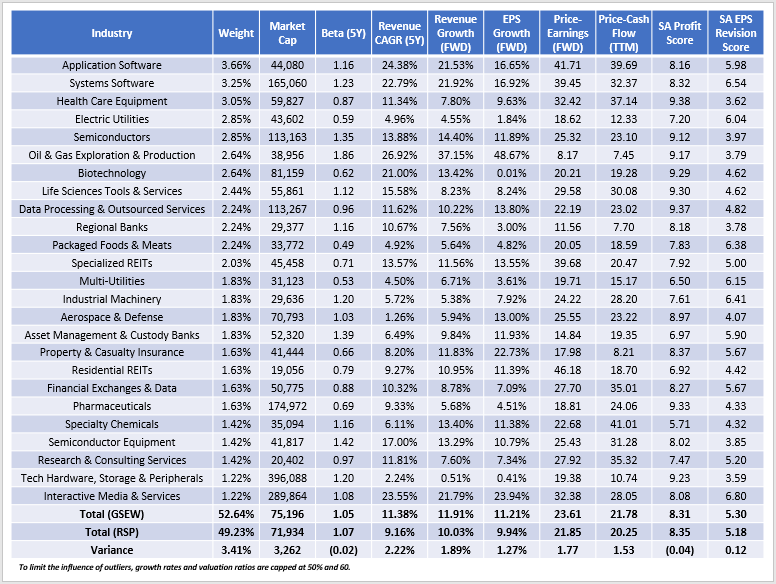
A few observations:
1. GSEW's slightly more concentrated in its top 25 industries than RSP (52.64% vs. 49.23%). The weighted-average market cap is also marginally higher. These figures make sense because the strategy selects the 500 largest by free-float market capitalization rather than the S&P's subjective approach.
2. Both portfolios are slightly more volatile than the market, as indicated by their 1.05 and 1.07 five-year beta figures.
3. GSEW has historical and estimated sales growth rates in the 11-12% range compared to 9-10% for RSP. These figures are consistent with Goldman Sachs' description of how the Solactive Index includes high-growth holdings that the S&P Index excludes.
4. S&P Index constituents require four consecutive quarters of profitability, so I'm surprised RSP's Profitability Score isn't stronger. Still, both trail SPY's 9.40/10 score, and the average for the 31 funds listed earlier is 8.72/10. That indicates that both ETFs include too many low-profitable companies, and investors might want to consider a more focused fund like EQWL.
5. GSEW trades at 23.61x forward earnings and 21.78x trailing cash flow, 1.77x and 1.53x higher than RSP. GARP investors may divide each ETF's earnings growth into its price-earnings ratio to compute a PEG ratio. The results are 2.11 for GSEW and 2.20 for RSP. Since lower figures are better, GSEW has a slight but not-meaningful advantage. For reference, the equal-weight Nasdaq-100 ETFs (QQQE, QQEW) are 2.00 and offer a better risk-reward than GSEW and RSP.
Investment Recommendation
This article analyzed GSEW's strategy, historical performance, and current fundamentals. GSEW's 0.09% expense ratio is the second-lowest but not enough to deliver superior returns. Many equal-weight ETFs like RSP, EQWL, and EQL have performed better since GSEW's inception, and I suspect it's due to the monthly rebalancing schedule. It's too frequent, and since many influential companies report close to month end, it limits the potential of a market that generally moves upward. GSEW's current fundamentals are slightly advantageous compared to RSP, though it does have a higher growth and valuation profile. It may outperform RSP if market sentiment turns positive after this earnings season but will still likely trail equal-weighted growth ETFs with better track records like QQQE and QQEW. Given these numerous alternatives, I don't recommend investors buy GSEW, and I look forward to discussing this further in the comments section below.
The Sunday Investor Joins Income Builder
The Sunday Investor has teamed up with Hoya Capital to launch the premier income-focused investing service on Seeking Alpha. Members receive complete early access to our articles along with exclusive income-focused model portfolios and a comprehensive suite of tools and models to help build sustainable portfolio income targeting premium dividend yields of up to 10%.
Whether your focus is High Yield or Dividend Growth, we’ve got you covered with actionable investment research focusing on real income-producing asset classes that offer potential diversification, monthly income, capital appreciation, and inflation hedging. Start A Free 2-Week Trial Today!