The total return for SLM (NASDAQ:SLM) investors has risen faster than earnings growth over the last three years
It hasn't been the best quarter for SLM Corporation (NASDAQ:SLM) shareholders, since the share price has fallen 19% in that time. But over three years, the returns would have left most investors smiling In the last three years the share price is up, 51%: better than the market.
Although SLM has shed US$95m from its market cap this week, let's take a look at its longer term fundamental trends and see if they've driven returns.
Check out our latest analysis for SLM
There is no denying that markets are sometimes efficient, but prices do not always reflect underlying business performance. One flawed but reasonable way to assess how sentiment around a company has changed is to compare the earnings per share (EPS) with the share price.
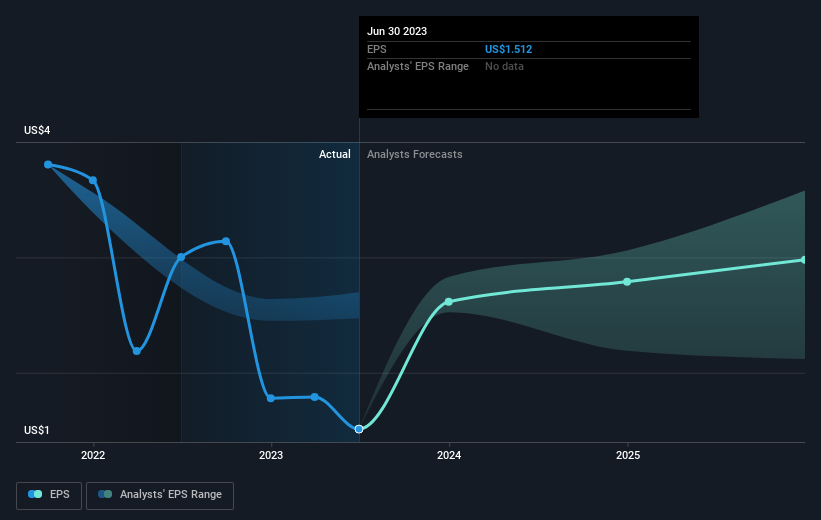
During three years of share price growth, SLM achieved compound earnings per share growth of 7.5% per year. This EPS growth is lower than the 15% average annual increase in the share price. So it's fair to assume the market has a higher opinion of the business than it did three years ago. It's not unusual to see the market 're-rate' a stock, after a few years of growth.
The image below shows how EPS has tracked over time (if you click on the image you can see greater detail).
It might be well worthwhile taking a look at our free report on SLM's earnings, revenue and cash flow.
What About Dividends?
As well as measuring the share price return, investors should also consider the total shareholder return (TSR). The TSR incorporates the value of any spin-offs or discounted capital raisings, along with any dividends, based on the assumption that the dividends are reinvested. Arguably, the TSR gives a more comprehensive picture of the return generated by a stock. As it happens, SLM's TSR for the last 3 years was 60%, which exceeds the share price return mentioned earlier. This is largely a result of its dividend payments!
A Different Perspective
Investors in SLM had a tough year, with a total loss of 12% (including dividends), against a market gain of about 18%. Even the share prices of good stocks drop sometimes, but we want to see improvements in the fundamental metrics of a business, before getting too interested. Longer term investors wouldn't be so upset, since they would have made 7%, each year, over five years. It could be that the recent sell-off is an opportunity, so it may be worth checking the fundamental data for signs of a long term growth trend. It's always interesting to track share price performance over the longer term. But to understand SLM better, we need to consider many other factors. Consider for instance, the ever-present spectre of investment risk. We've identified 3 warning signs with SLM (at least 1 which is significant) , and understanding them should be part of your investment process.
We will like SLM better if we see some big insider buys. While we wait, check out this free list of growing companies with considerable, recent, insider buying.
Please note, the market returns quoted in this article reflect the market weighted average returns of stocks that currently trade on American exchanges.
Have feedback on this article? Concerned about the content? Get in touch with us directly. Alternatively, email editorial-team (at) simplywallst.com.
This article by Simply Wall St is general in nature. We provide commentary based on historical data and analyst forecasts only using an unbiased methodology and our articles are not intended to be financial advice. It does not constitute a recommendation to buy or sell any stock, and does not take account of your objectives, or your financial situation. We aim to bring you long-term focused analysis driven by fundamental data. Note that our analysis may not factor in the latest price-sensitive company announcements or qualitative material. Simply Wall St has no position in any stocks mentioned.
