Cross-Sector: Market Data Highlights
CROSS-SECTOR
DATA REPORT
15 April 2021
CLIENT SERVICES
Americas
1-212-553-1653
Asia Pacific
852-3551-3077
Japan
81-3-5408-4100
EMEA
44-20-7772-5454
Cross-Sector
Market Data Highlights
The latest market data from Weekly Market Outlook. Click
for access to the full WMO.
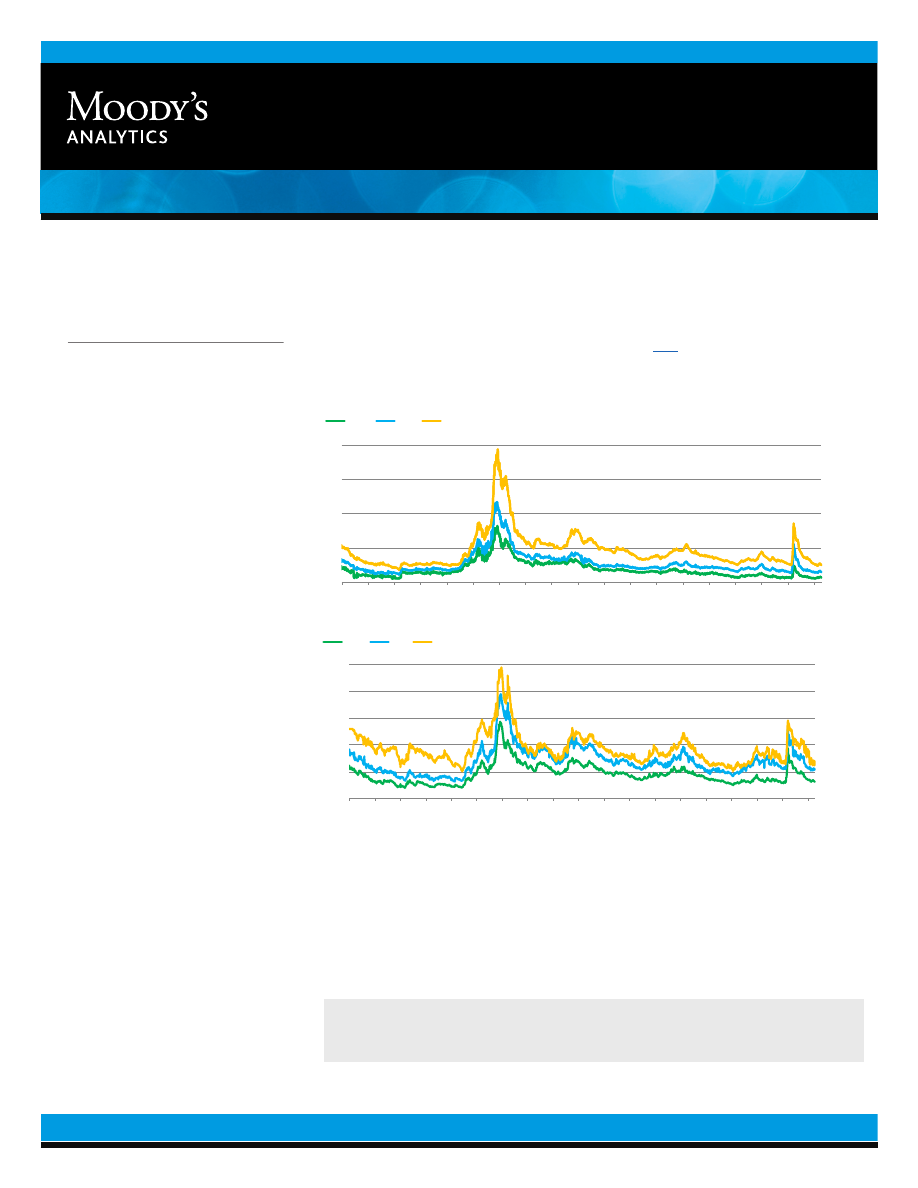
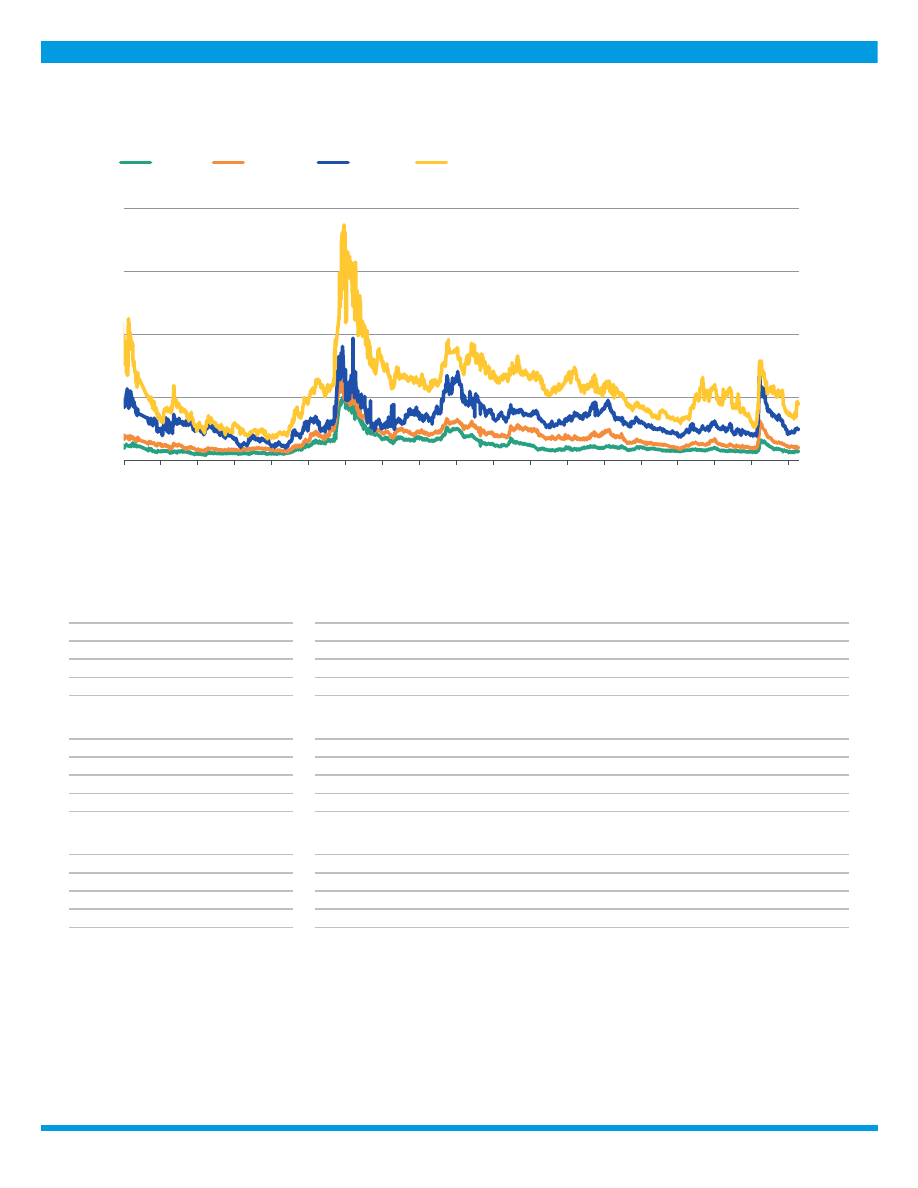
SPREADS
0
200
400
600
800
0
200
400
600
800
2003 2004 2005 2006 2007 2008 2009 2010 2011 2012 2013 2014 2015 2016 2017 2018 2019 2020 2021
Spread (bp)
Spread (bp)
Aa2
A2
Baa2
Source: Moody's
Figure 1: 5-Year Median Spreads-Global Data (High Grade)
0
400
800
1,200
1,600
2,000
0
400
800
1,200
1,600
2,000
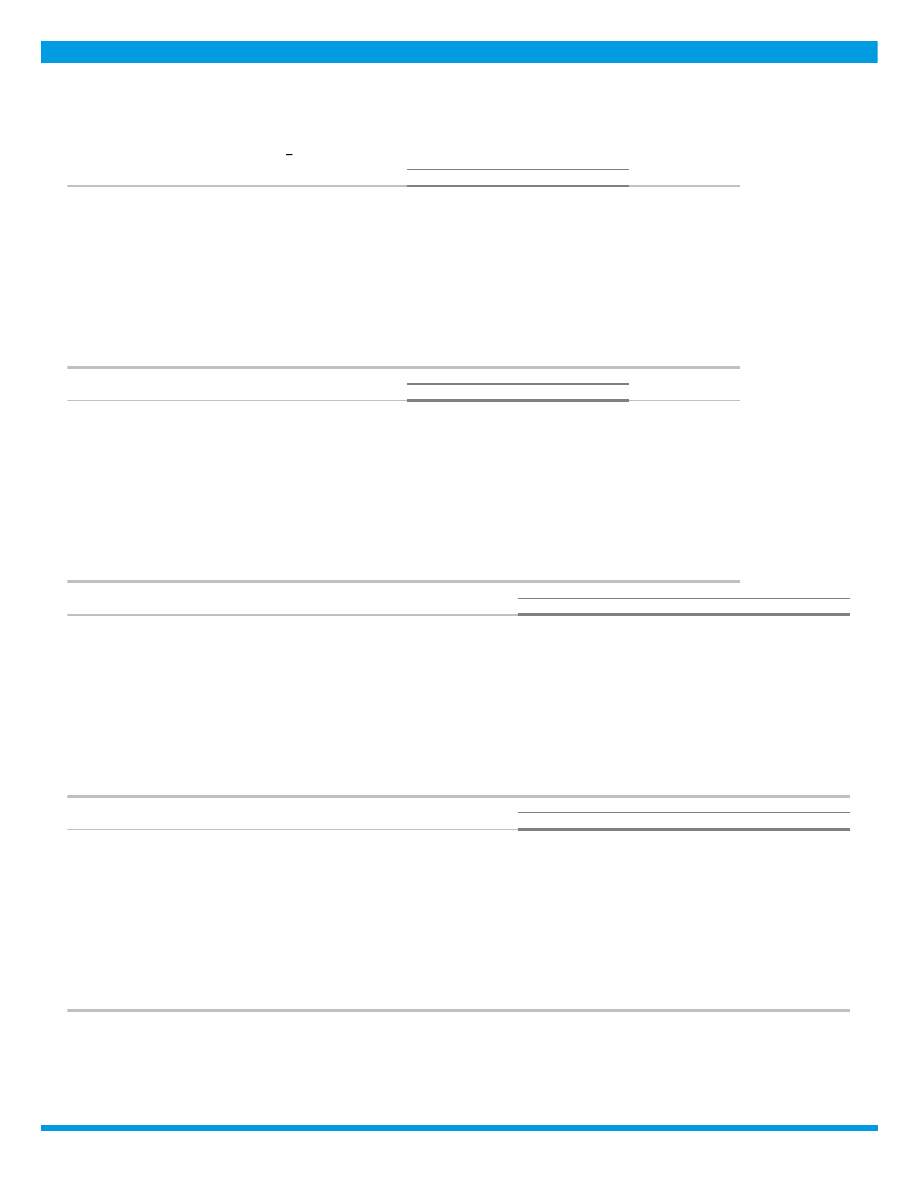
2003 2004 2005 2006 2007 2008 2009 2010 2011 2012 2013 2014 2015 2016 2017 2018 2019 2020 2021
Spread (bp)
Spread (bp)
Ba2
B2
Caa-C
Source: Moody's
Figure 2: 5-Year Median Spreads-Global Data (High Yield)
Moody’s Analytics markets and distributes all Moody’s Capital Markets Research, Inc. materials. Moody’s Capital Markets
Research,Inc. is a subsidiary of Moody’s Corporation. Moody’s Analytics does not provide investment advisory services or
products. For further detail, please see the last page.
MOODY'S ANALYTICS
CROSS-SECTOR
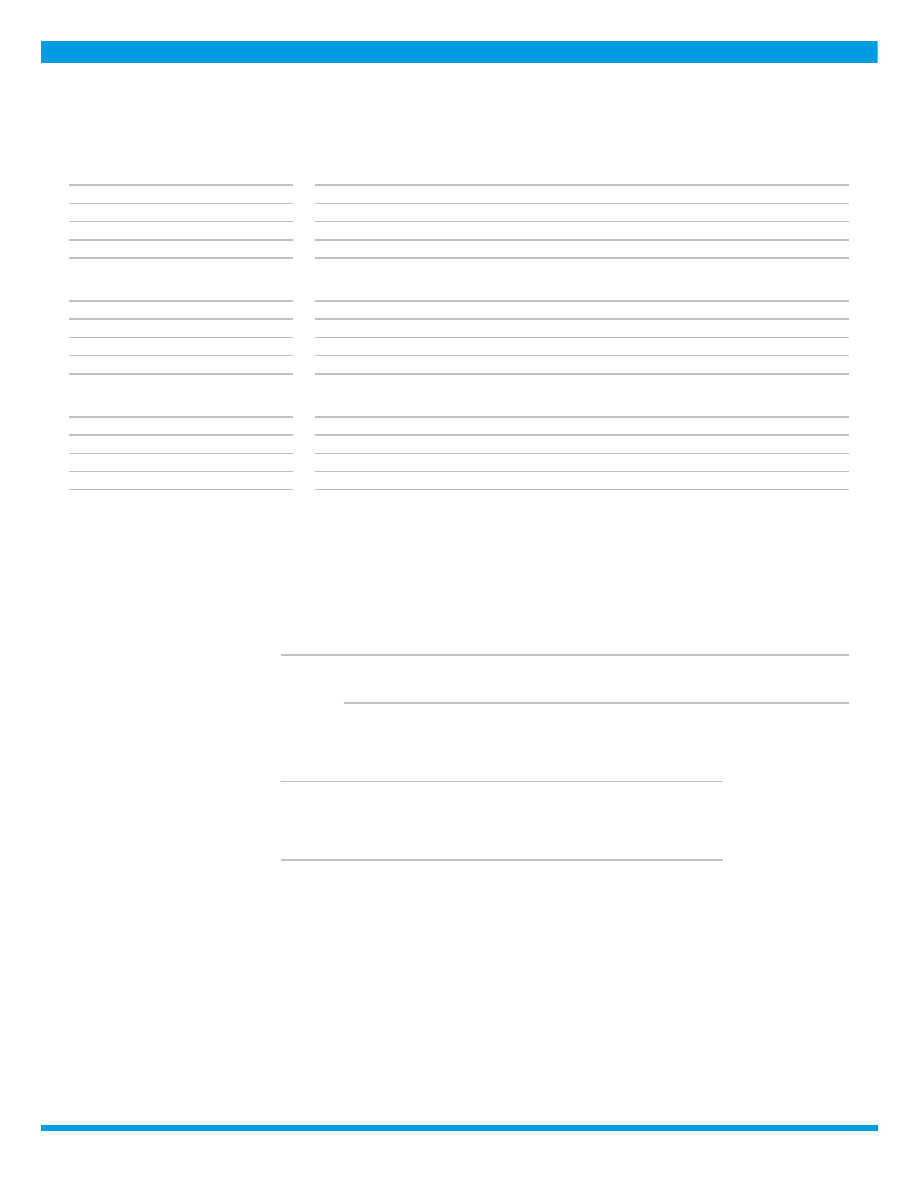
CDS MOVERS
CDS Implied Rating Rises
Issuer
Apr. 14
Apr. 7
Senior Ratings
Illinois Tool Works Inc.
A1
Baa2
A2
Univision Communications Inc.
B2
Caa1
Caa2
Texas Instruments, Incorporated
A2
Baa1
A1
JPMorgan Chase & Co.
A2
A3
A2
Citigroup Inc.
Baa1
Baa2
A3
Bank of America Corporation
A2
A3
A2
Wells Fargo & Company
Baa1
Baa2
A2
Morgan Stanley
Baa1
Baa2
A1
Verizon Communications Inc.
Baa1
Baa2
Baa1
John Deere Capital Corporation
A2
A3
A2
CDS Implied Rating Declines
Issuer
Apr. 14
Apr. 7
Senior Ratings
Republic Services, Inc.
Baa2
A3
Baa2
Alliant Energy Corporation
Baa2
A3
Baa2
Toyota Motor Credit Corporation
A1
Aa3
A1
Microsoft Corporation
Aa3
Aa2
Aaa
McDonald's Corporation
Aa3
Aa2
Baa1
CVS Health Corporation
A3
A2
Baa2
Walmart Inc.
Aa3
Aa2
Aa2
PepsiCo, Inc.
A2
A1
A1
Caterpillar Financial Services Corporation
A2
A1
A3
Coca-Cola Company (The)
A1
Aa3
A1
CDS Spread Increases
Issuer
Senior Ratings
Apr. 14
Apr. 7
Spread Diff
Service Corporation International
Ba3
174
148
26
Rite Aid Corporation
Caa3
711
687
24
Tenet Healthcare Corporation
Caa1
323
301
23
United States Steel Corporation
Caa1
405
382
22
Commercial Metals Company
Ba2
301
284
18
Meritor, Inc.
B1
228
213
16
K. Hovnanian Enterprises, Inc.
Caa3
601
587
15
NRG Energy, Inc.
Ba2
166
153
13
Travel + Leisure Co.
B1
150
137
13
Meritage Homes Corporation
Ba1
173
160
13
CDS Spread Decreases
Issuer
Senior Ratings
Apr. 14
Apr. 7
Spread Diff
Talen Energy Supply, LLC
B3
1,147
1,237
-91
American Airlines Group Inc.
Caa1
771
822
-51
R.R. Donnelley & Sons Company
B3
511
556
-46
Univision Communications Inc.
Caa2
304
344
-40
Illinois Tool Works Inc.
A2
35
63
-28
Nabors Industries , Inc.
Caa2
1,056
1,083
-27
Royal Caribbean Cruises Ltd.
B2
352
373
-21
Dish DBS Corporation
B2
393
406
-13
L Brands, Inc.
Ba3
152
162
-11
Avient Corporation
Ba3
173
184
-11
Source: Moody's, CMA
CDS Spreads
CDS Implied Ratings
CDS Implied Ratings
CDS Spreads
Figure 3. CDS Movers - US ( April 7, 2021 April 14, 2021)
2 15 April 2021
Cross-Sector: Market Data Highlights
MOODY'S ANALYTICS
CROSS-SECTOR
CDS Implied Rating Rises
Issuer
Apr. 14
Apr. 7
Senior Ratings
Schaeffler Finance B.V.
A2
Baa2
Ba2
Sanofi
Aa2
Aa3
A1
Banca Monte dei Paschi di Siena S.p.A .
Ba2
Ba3
Caa1
AstraZeneca PLC
Aa3
A1
A3
Alpha Bank AE
Caa1
Caa2
Caa1
Caixa Geral de Depositos, S.A.
Baa3
Ba1
Ba1
Jaguar Land Rover Automotive Plc
B3
Caa1
B1
Evonik Industries AG
Baa2
Baa3
Baa1
BAE SYSTEMS plc
Baa1
Baa2
Baa2
Smurfit Kappa Acquisitions
Baa2
Baa3
Baa3
CDS Implied Rating Declines
Issuer
Apr. 14
Apr. 7
Senior Ratings
France , Government of
Aa2
Aa1
Aa2
Rabobank
Aa3
Aa2
Aa3
Barclays Bank PLC
Baa1
A3
A1
BNP Paribas
A2
A1
Aa3
Banco Santander S.A. ( Spain )
A2
A1
A2
ABN AMRO Bank N.V.
Aa3
Aa2
A1
Portugal , Government of
A1
Aa3
Baa3
HSBC Holdings plc
A3
A2
A2
Credit Agricole S.A.
A1
Aa3
Aa3
Credit Agricole Corporate and Investment Bank
A1
Aa3
Aa3
CDS Spread Increases
Issuer
Senior Ratings
Apr. 14
Apr. 7
Spread Diff
TUI AG
Caa1
896
782
114
Vedanta Resources Limited
Caa1
900
831
69
Novafives S.A.S.
Caa2
743
704
39
Koninklijke KPN N.V.
Baa3
108
75
33
Iceland Bondco plc
Caa2
397
377
19
Casino Guichard-Perrachon SA
Caa1
511
498
14
Stena AB
Caa1
569
557
12
Permanent tsb p.l.c.
Baa2
219
206
12
Deutsche Lufthansa Aktiengesellschaft
Ba2
270
259
11
Sappi Papier Holding GmbH
Ba2
352
344
9
CDS Spread Decreases
Issuer
Senior Ratings
Apr. 14
Apr. 7
Spread Diff
Evonik Industries AG
Baa1
62
74
-12
Vue International Bidco plc
Ca
615
627
-12
Schaeffler Finance B.V.
Ba2
43
54
-11
Banca Monte dei Paschi di Siena S.p.A .
Caa1
189
194
-5
Hammerson Plc
Baa3
240
245
-5
Boparan Finance plc
Caa1
682
687
-5
Credit Suisse Group AG
Baa1
61
64
-3
Credit Suisse AG
Aa3
56
59
-3
Experian Finance plc
Baa1
30
33
-3
Novo Banco, S.A.
Caa2
169
172
-3
Source: Moody's, CMA
CDS Spreads
CDS Implied Ratings
CDS Implied Ratings
CDS Spreads
Figure 4. CDS Movers - Europe ( April 7, 2021 April 14, 2021)
3 15 April 2021
Cross-Sector: Market Data Highlights
MOODY'S ANALYTICS
CROSS-SECTOR
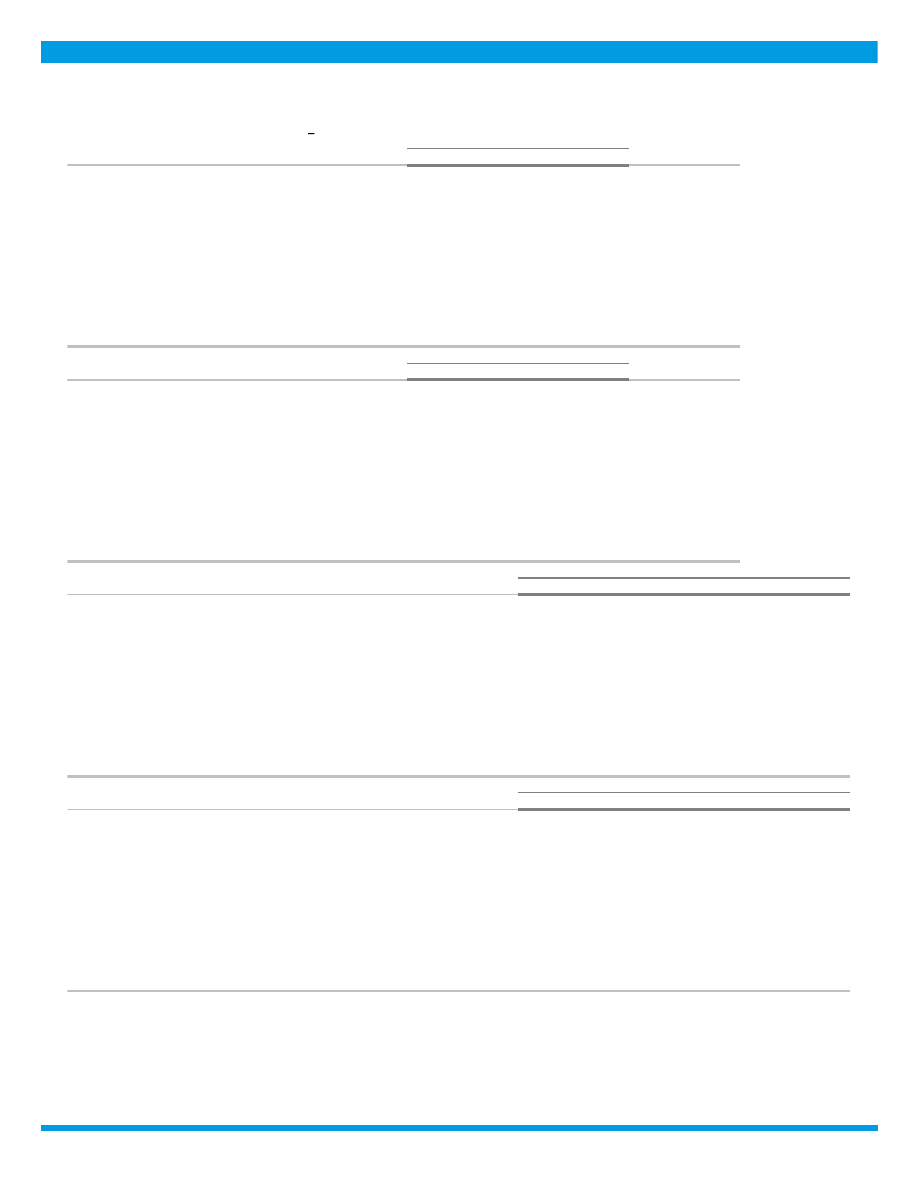
ISSUANCE
0
700
1,400
2,100
2,800
0
700
1,400
2,100
2,800
Jan
Feb
Mar
Apr
May
Jun
Jul
Aug
Sep
Oct
Nov
Dec
Issuance ($B)
Issuance ($B)
2018
2019
2020
2021
Source:
Moody's / Dealogic
Figure 5. Market Cumulative Issuance - Corporate & Financial Institutions: USD Denominated
0
200
400
600
800
1,000
0
200
400
600
800
1,000
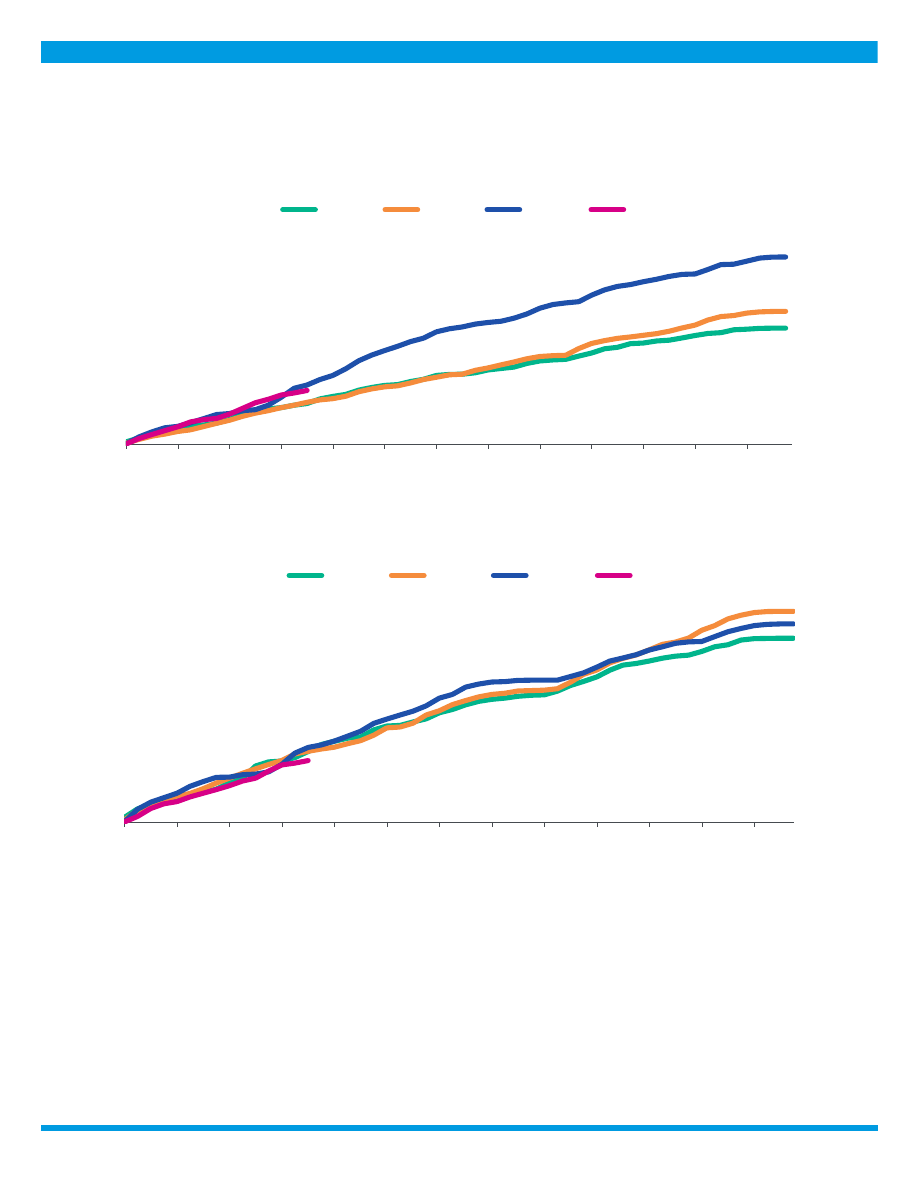
Jan
Feb
Mar
Apr
May
Jun
Jul
Aug
Sep
Oct
Nov
Dec
Issuance ($B)
Issuance ($B)
2018
2019
2020
2021
Source:
Moody's / Dealogic
Figure 6. Market Cumulative Issuance - Corporate & Financial Institutions: Euro Denominated
4 15 April 2021
Cross-Sector: Market Data Highlights
MOODY'S ANALYTICS
CROSS-SECTOR
Investment-Grade
High-Yield
Total*
Amount
Amount
Amount
$B
$B
$B
Weekly
21.170
11.950
34.120
Year-to-Date
517.552
222.205
757.701
Investment-Grade
High-Yield
Total*
Amount
Amount
Amount
$B
$B
$B
Weekly
7.581
2.540
11.898
Year-to-Date
226.928
45.315
283.727
* Difference represents issuance with pending ratings.
Source: Moody's/ Dealogic
USD Denominated
Euro Denominated
Figure 7. Issuance: Corporate & Financial Institutions
EMERGING MARKET CREDIT SPREADS
Emerging Market
Duration
A
Baa
Ba
B
A
Baa
Ba
B
>=1 and <3
64
112
265
465
66
127
55
47
>=3 and <5
89
125
297
542
73
121
58
53
>=5 and <7
102
162
323
567
46
91
27
21
>=7
123
211
371
588
127
211
58
39
Emerging Market Sovereign
Duration
A
Baa
Ba
B
A
Baa
Ba
B
>=1 and <3
37
64
112
465
16
27
15
19
>=3 and <5
44
88
216
517
17
35
24
30
>=5 and <7
80
124
284
572
18
32
19
20
>=7
71
194
344
587
82
111
47
38
Emerging Market Corporate
Duration
A
Baa
Ba
B
A
Baa
Ba
B
>=1 and <3
70
122
297
480
50
100
40
28
>=3 and <5
91
158
349
619
56
86
34
23
>=5 and <7
123
195
378
274
28
59
8
1
>=7
145
237
562
633
45
100
11
1
Source: Moody's
Median Spreads
Bond Counts
Median Spreads
Bond Counts
Figure 8. Emerging Market Median OAS
Bond Counts
Median Spreads
5 15 April 2021
Cross-Sector: Market Data Highlights
MOODY'S ANALYTICS
CROSS-SECTOR
0
600
1,200
1,800
2,400
0
600
1,200
1,800
2,400
2003 2004 2005 2006 2007 2008 2009 2010 2011 2012 2013 2014 2015 2016 2017 2018 2019 2020 2021
Spread (bp)
Spread (bp)
A
Baa
Ba
B
Source: Moody's
Figure 9: Emerging Markets Median Credit Spreads (3-5 year duration)
MEDIAN CREDIT SPREADS
Duration
Aaa
Aa
A
Baa
Ba
B
Caa
>=1 and <3
5
24
41
74
204
464
497
>=3 and <5
11
34
55
104
253
584
490
>=5 and <7
20
32
69
134
292
344
-
>=7
25
43
83
157
226
342
399
Duration
Aaa
Aa
A
Baa
Ba
B
Caa
>=1 and <3
347
277
446
270
77
26
7
>=3 and <5
187
203
371
295
67
19
2
>=5 and <7
105
138
210
148
17
3
-
>=7
127
287
523
251
15
2
2
Duration
Aaa
Aa
A
Baa
Ba
B
Caa
>=1 and <3
24
83
172
154
48
24
7
>=3 and <5
30
78
152
160
43
17
2
>=5 and <7
26
64
100
90
13
3
-
>=7
31
90
157
113
11
2
1
Source: Moody's
Figure 10. Global Financial Institutions Median Credit Spreads
Median Spreads
Debt Counts
Issuer Counts
6 15 April 2021
Cross-Sector: Market Data Highlights
MOODY'S ANALYTICS
CROSS-SECTOR
Duration
Aaa
Aa
A
Baa
Ba
B
Caa
>=1 and <3
12
29
39
57
260
406
542
>=3 and <5
25
41
50
76
279
404
559
>=5 and <7
24
53
66
101
284
350
539
>=7
45
97
111
149
297
409
510
Duration
Aaa
Aa
A
Baa
Ba
B
Caa
>=1 and <3
39
121
497
851
310
230
55
>=3 and <5
35
129
495
997
296
210
72
>=5 and <7
21
89
400
834
185
101
22
>=7
42
292
1455
2055
221
44
8
Duration
Aaa
Aa
A
Baa
Ba
B
Caa
>=1 and <3
10
54
256
491
221
187
49
>=3 and <5
9
53
268
571
191
171
63
>=5 and <7
9
39
227
494
131
88
22
>=7
7
56
351
608
104
27
7
Source: Moody's
Issuer Counts
Figure 11. Global Corporate Median Credit Spreads
Median Spreads
Debt Counts
MEDIAN 5-YEAR CDS SPREADS
Global Median Spreads by Fine Rating Category
Aaa
Aa1
Aa2
Aa3
A1
A2
A3
Baa1
Baa2
14
17
21
27
33
41
46
52
58
Baa3
Ba1
Ba2
Ba3
B1
B2
B3
Caa
83
120
173
210
256
312
338
537
Global Median Spreads by Broad Rating Category
Aaa
Aa
A
Baa
Ba
B
Caa
19
37
41
58
173
312
397
Global Issuer Counts by Broad Rating Category
Aaa
Aa
A
Baa
Ba
B
Caa
9
53
169
346
100
44
31
Source: Moody's, CMA
Figure 12. Global Median CDS Spreads By Rating Category
7 15 April 2021
Cross-Sector: Market Data Highlights

MOODY'S ANALYTICS
CROSS-SECTOR
Region
Aaa
Aa
A
Baa
Ba
B
Caa
North America
19
36
41
65
162
282
402
Europe
9
29
40
57
146
229
509
Asia Pacific (ex.Japan)
17
23
42
68
147
345
-
Japan
-
-
23
28
49
68
-
Region
Aaa
Aa
A
Baa
Ba
B
Caa
North America
3
20
84
210
61
31
15
Europe
6
33
80
124
28
10
14
Asia Pacific (ex.Japan)
3
18
31
35
5
2
-
Japan
-
-
32
15
3
1
-
Source: Moody's, CMA
Issuer Counts
Figure 13. Median CDS Spreads By Region
Median CDS Spreads
Sector
Aaa
Aa
A
Baa
Ba
B
Caa
Corporates
22
31
37
61
157
275
549
Financials
10
29
41
61
180
369
296
Sovereigns
10
11
44
54
104
369
-
Banks
-
30
43
66
214
-
213
Sector
Aaa
Aa
A
Baa
Ba
B
Caa
Corporates
4
24
148
330
89
46
25
Financials
8
47
84
66
19
1
6
Banks
-
35
53
28
10
-
5
Sovereigns
8
6
4
6
3
1
-
Source: Moody's, CMA
Figure 14. Global Median CDS Spreads by Sector
Median CDS Spreads
Issuer Counts
8 15 April 2021
Cross-Sector: Market Data Highlights

MOODY'S ANALYTICS
CROSS-SECTOR
Region
Aaa
Aa
A
Baa
Ba
B
Caa
North America
10
41
43
66
197
-
579
Europe
9
30
43
63
130
-
213
Asia Pacific (ex.Japan)
16
22
43
67
104
369
-
Japan
-
-
25
42
-
-
-
Region
Aaa
Aa
A
Baa
Ba
B
Caa
North America
1
8
22
24
7
-
1
Europe
5
26
38
26
6
-
5
Asia Pacific (ex.Japan)
2
13
13
12
3
1
-
Japan
-
-
11
2
-
-
-
Source: Moody's, CMA
Figure 15. Global Financial Institutions Median CDS Spreads by Region
Median CDS Spreads
Issuer Counts
Region
Aaa
Aa
A
Baa
Ba
B
Caa
North America
22
33
40
65
160
282
399
Europe
9
24
38
55
146
229
615
Asia Pacific (ex.Japan)
31
27
41
68
155
320
-
Japan
-
-
22
28
49
68
-
Region
Aaa
Aa
A
Baa
Ba
B
Caa
North America
2
12
62
186
54
31
14
Europe
1
7
42
98
22
10
9
Asia Pacific (ex.Japan)
1
5
18
23
2
1
-
Japan
-
-
21
13
3
1
-
Source: Moody's, CMA
Median CDS Spreads
Issuer Counts
Figure 16. Global Corporates Median CDS Spreads by Region
9 15 April 2021
Cross-Sector: Market Data Highlights

MOODY'S ANALYTICS
CROSS-SECTOR
© 2021 Moody’s Corporation, Moody’s Investors Service, Inc. , Moody’s Analytics, Inc. and/or their licensors and affiliates (collectively, “MOODY’S”). All rights reserved.
CREDIT RATINGS ISSUED BY MOODY'S CREDIT RATINGS AFFILIATES ARE THEIR CURRENT OPINIONS OF THE RELATIVE FUTURE CREDIT RISK OF ENTITIES, CREDIT
COMMITMENTS, OR DEBT OR DEBT-LIKE SECURITIES, AND MATERIALS, PRODUCTS, SERVICES AND INFORMATION PUBLISHED BY MOODY’S (COLLECTIVELY,
“PUBLICATIONS”) MAY INCLUDE SUCH CURRENT OPINIONS. MOODY’S DEFINES CREDIT RISK AS THE RISK THAT AN ENTITY MAY NOT MEET ITS CONTRACTUAL
FINANCIAL OBLIGATIONS AS THEY COME DUE AND ANY ESTIMATED FINANCIAL LOSS IN THE EVENT OF DEFAULT OR IMPAIRMENT. SEE APPLICABLE MOODY’S
RATING SYMBOLS AND DEFINITIONS PUBLICATION FOR INFORMATION ON THE TYPES OF CONTRACTUAL FINANCIAL OBLIGATIONS ADDRESSED BY MOODY’S
CREDIT RATINGS. CREDIT RATINGS DO NOT ADDRESS ANY OTHER RISK, INCLUDING BUT NOT LIMITED TO: LIQUIDITY RISK, MARKET VALUE RISK, OR PRICE
VOLATILITY. CREDIT RATINGS, NON-CREDIT ASSESSMENTS (“ASSESSMENTS”), AND OTHER OPINIONS INCLUDED IN MOODY’S PUBLICATIONS ARE NOT
STATEMENTS OF CURRENT OR HISTORICAL FACT. MOODY’S PUBLICATIONS MAY ALSO INCLUDE QUANTITATIVE MODEL-BASED ESTIMATES OF CREDIT RISK AND
RELATED OPINIONS OR COMMENTARY PUBLISHED BY MOODY’S ANALYTICS, INC. AND/OR ITS AFFILIATES. MOODY’S CREDIT RATINGS, ASSESSMENTS, OTHER
OPINIONS AND PUBLICATIONS DO NOT CONSTITUTE OR PROVIDE INVESTMENT OR FINANCIAL ADVICE, AND MOODY’S CREDIT RATINGS, ASSESSMENTS, OTHER
OPINIONS AND PUBLICATIONS ARE NOT AND DO NOT PROVIDE RECOMMENDATIONS TO PURCHASE, SELL, OR HOLD PARTICULAR SECURITIES. MOODY’S CREDIT
RATINGS, ASSESSMENTS, OTHER OPINIONS AND PUBLICATIONS DO NOT COMMENT ON THE SUITABILITY OF AN INVESTMENT FOR ANY PARTICULAR INVESTOR.
MOODY’S ISSUES ITS CREDIT RATINGS, ASSESSMENTS AND OTHER OPINIONS AND PUBLISHES ITS PUBLICATIONS WITH THE EXPECTATION AND UNDERSTANDING
THAT EACH INVESTOR WILL, WITH DUE CARE, MAKE ITS OWN STUDY AND EVALUATION OF EACH SECURITY THAT IS UNDER CONSIDERATION FOR PURCHASE,
HOLDING, OR SALE.
MOODY’S CREDIT RATINGS, ASSESSMENTS, OTHER OPINIONS, AND PUBLICATIONS ARE NOT INTENDED FOR USE BY RETAIL INVESTORS AND IT WOULD BE RECKLESS
AND INAPPROPRIATE FOR RETAIL INVESTORS TO USE MOODY’S CREDIT RATINGS, ASSESSMENTS, OTHER OPINIONS OR PUBLICATIONS WHEN MAKING AN INVESTMENT
DECISION. IF IN DOUBT YOU SHOULD CONTACT YOUR FINANCIAL OR OTHER PROFESSIONAL ADVISER.
ALL INFORMATION CONTAINED HEREIN IS PROTECTED BY LAW, INCLUDING BUT NOT LIMITED TO, COPYRIGHT LAW, AND NONE OF SUCH INFORMATION MAY BE COPIED
OR OTHERWISE REPRODUCED, REPACKAGED, FURTHER TRANSMITTED, TRANSFERRED, DISSEMINATED, REDISTRIBUTED OR RESOLD, OR STORED FOR SUBSEQUENT USE
FOR ANY SUCH PURPOSE, IN WHOLE OR IN PART, IN ANY FORM OR MANNER OR BY ANY MEANS WHATSOEVER, BY ANY PERSON WITHOUT MOODY’S PRIOR WRITTEN
CONSENT.
MOODY’S CREDIT RATINGS, ASSESSMENTS, OTHER OPINIONS AND PUBLICATIONS ARE NOT INTENDED FOR USE BY ANY PERSON AS A BENCHMARK AS THAT TERM IS
DEFINED FOR REGULATORY PURPOSES AND MUST NOT BE USED IN ANY WAY THAT COULD RESULT IN THEM BEING CONSIDERED A BENCHMARK.
All information contained herein is obtained by MOODY’S from sources believed by it to be accurate and reliable. Because of the possibility of human or mechanical error as well
as other factors, however, all information contained herein is provided “AS IS” without warranty of any kind. MOODY'S adopts all necessary measures so that the information it
uses in assigning a credit rating is of sufficient quality and from sources MOODY'S considers to be reliable including, when appropriate, independent third-party sources. However,
MOODY’S is not an auditor and cannot in every instance independently verify or validate information received in the rating process or in preparing its Publications.
To the extent permitted by law, MOODY’S and its directors, officers, employees, agents, representatives, licensors and suppliers disclaim liability to any person or entity for any
indirect, special, consequential, or incidental losses or damages whatsoever arising from or in connection with the information contained herein or the use of or inability to use any
such information, even if MOODY’S or any of its directors, officers, employees, agents, representatives, licensors or suppliers is advised in advance of the possibility of such losses or
damages, including but not limited to: (a) any loss of present or prospective profits or (b) any loss or damage arising where the relevant financial instrument is not the subject of a
particular credit rating assigned by MOODY’S.
To the extent permitted by law, MOODY’S and its directors, officers, employees, agents, representatives, licensors and suppliers disclaim liability for any direct or compensatory
losses or damages caused to any person or entity, including but not limited to by any negligence (but excluding fraud, willful misconduct or any other type of liability that, for the
avoidance of doubt, by law cannot be excluded) on the part of, or any contingency within or beyond the control of, MOODY’S or any of its directors, officers, employees, agents,
representatives, licensors or suppliers, arising from or in connection with the information contained herein or the use of or inability to use any such information.
NO WARRANTY, EXPRESS OR IMPLIED, AS TO THE ACCURACY, TIMELINESS, COMPLETENESS, MERCHANTABILITY OR FITNESS FOR ANY PARTICULAR PURPOSE OF ANY CREDIT
RATING, ASSESSMENT, OTHER OPINION OR INFORMATION IS GIVEN OR MADE BY MOODY’S IN ANY FORM OR MANNER WHATSOEVER.
Moody’s Investors Service, Inc. , a wholly-owned credit rating agency subsidiary of Moody’s Corporation (“MCO”), hereby discloses that most issuers of debt securities (including
corporate and municipal bonds, debentures, notes and commercial paper) and preferred stock rated by Moody’s Investors Service, Inc. have, prior to assignment of any credit rating,
agreed to pay to Moody’s Investors Service, Inc. for credit ratings opinions and services rendered by it fees ranging from $1,000 to approximately $5,000,000 . MCO and Moody’s
Investors Service also maintain policies and procedures to address the independence of Moody’s Investors Service credit ratings and credit rating processes. Information regarding
certain affiliations that may exist between directors of MCO and rated entities, and between entities who hold credit ratings from Moody’s Investors Service and have also publicly
reported to the SEC an ownership interest in MCO of more than 5%, is posted annually at
under the heading “Investor Relations — Corporate Governance —
Director and Shareholder Affiliation Policy.”
Additional terms for Australia only: Any publication into Australia of this document is pursuant to the Australian Financial Services License of MOODY’S affiliate, Moody’s Investors
Service Pty Limited ABN 61 003 399 657AFSL 336969 and/or Moody’s Analytics Australia Pty Ltd ABN 94 105 136 972 AFSL 383569 (as applicable). This document is intended
to be provided only to “wholesale clients” within the meaning of section 761G of the Corporations Act 2001. By continuing to access this document from within Australia , you
represent to MOODY’S that you are, or are accessing the document as a representative of, a “wholesale client” and that neither you nor the entity you represent will directly or
indirectly disseminate this document or its contents to “retail clients” within the meaning of section 761G of the Corporations Act 2001. MOODY’S credit rating is an opinion as to
the creditworthiness of a debt obligation of the issuer, not on the equity securities of the issuer or any form of security that is available to retail investors.
Additional terms for Japan only: Moody's Japan K.K. (“MJKK”) is a wholly-owned credit rating agency subsidiary of Moody's Group Japan G.K., which is wholly-owned by Moody’s
Overseas Holdings Inc. , a wholly-owned subsidiary of MCO. Moody’s SF Japan K.K. (“MSFJ”) is a wholly-owned credit rating agency subsidiary of MJKK. MSFJ is not a Nationally
Recognized Statistical Rating Organization (“NRSRO”). Therefore, credit ratings assigned by MSFJ are Non-NRSRO Credit Ratings. Non-NRSRO Credit Ratings are assigned by an
entity that is not a NRSRO and, consequently, the rated obligation will not qualify for certain types of treatment under U.S. laws. MJKK and MSFJ are credit rating agencies registered
with the Japan Financial Services Agency and their registration numbers are FSA Commissioner (Ratings) No. 2 and 3 respectively.
MJKK or MSFJ (as applicable) hereby disclose that most issuers of debt securities (including corporate and municipal bonds, debentures, notes and commercial paper) and preferred
stock rated by MJKK or MSFJ (as applicable) have, prior to assignment of any credit rating, agreed to pay to MJKK or MSFJ (as applicable) for credit ratings opinions and services
rendered by it fees ranging from JPY125,000 to approximately JPY550,000,000 .
MJKK and MSFJ also maintain policies and procedures to address Japanese regulatory requirements.
REPORT NUMBER
1278643
10 15 April 2021
Cross-Sector: Market Data Highlights

MOODY'S ANALYTICS
CROSS-SECTOR
CLIENT SERVICES
Americas
1-212-553-1653
Asia Pacific
852-3551-3077
Japan
81-3-5408-4100
EMEA
44-20-7772-5454
11 15 April 2021
Cross-Sector: Market Data Highlights
