Estimating The Fair Value Of Diamondback Energy, Inc. (NASDAQ:FANG)
Key Insights
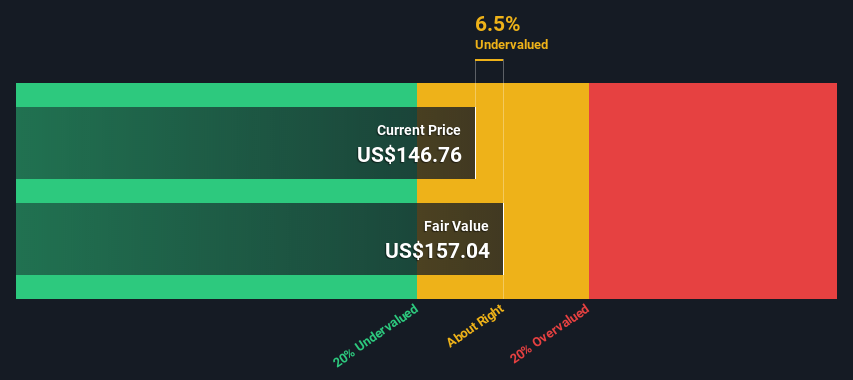
Using the 2 Stage Free Cash Flow to Equity, Diamondback Energy fair value estimate is US$157
Diamondback Energy's US$147 share price indicates it is trading at similar levels as its fair value estimate
The US$176 analyst price target for FANG is 12% more than our estimate of fair value
How far off is Diamondback Energy, Inc. (NASDAQ:FANG) from its intrinsic value? Using the most recent financial data, we'll take a look at whether the stock is fairly priced by estimating the company's future cash flows and discounting them to their present value. One way to achieve this is by employing the Discounted Cash Flow (DCF) model. There's really not all that much to it, even though it might appear quite complex.
Remember though, that there are many ways to estimate a company's value, and a DCF is just one method. If you still have some burning questions about this type of valuation, take a look at the Simply Wall St analysis model.
See our latest analysis for Diamondback Energy
Is Diamondback Energy Fairly Valued?
We are going to use a two-stage DCF model, which, as the name states, takes into account two stages of growth. The first stage is generally a higher growth period which levels off heading towards the terminal value, captured in the second 'steady growth' period. In the first stage we need to estimate the cash flows to the business over the next ten years. Where possible we use analyst estimates, but when these aren't available we extrapolate the previous free cash flow (FCF) from the last estimate or reported value. We assume companies with shrinking free cash flow will slow their rate of shrinkage, and that companies with growing free cash flow will see their growth rate slow, over this period. We do this to reflect that growth tends to slow more in the early years than it does in later years.
Generally we assume that a dollar today is more valuable than a dollar in the future, so we need to discount the sum of these future cash flows to arrive at a present value estimate:
10-year free cash flow (FCF) estimate
2023 | 2024 | 2025 | 2026 | 2027 | 2028 | 2029 | 2030 | 2031 | 2032 | |
Levered FCF ($, Millions) | US$3.66b | US$3.32b | US$3.00b | US$3.07b | US$2.95b | US$2.89b | US$2.86b | US$2.86b | US$2.88b | US$2.91b |
Growth Rate Estimate Source | Analyst x11 | Analyst x9 | Analyst x3 | Analyst x1 | Est @ -3.87% | Est @ -2.08% | Est @ -0.84% | Est @ 0.03% | Est @ 0.64% | Est @ 1.07% |
Present Value ($, Millions) Discounted @ 9.7% | US$3.3k | US$2.8k | US$2.3k | US$2.1k | US$1.9k | US$1.7k | US$1.5k | US$1.4k | US$1.3k | US$1.2k |
("Est" = FCF growth rate estimated by Simply Wall St)
Present Value of 10-year Cash Flow (PVCF) = US$19b
The second stage is also known as Terminal Value, this is the business's cash flow after the first stage. The Gordon Growth formula is used to calculate Terminal Value at a future annual growth rate equal to the 5-year average of the 10-year government bond yield of 2.1%. We discount the terminal cash flows to today's value at a cost of equity of 9.7%.
Terminal Value (TV)= FCF2032 × (1 + g) ÷ (r – g) = US$2.9b× (1 + 2.1%) ÷ (9.7%– 2.1%) = US$39b
Present Value of Terminal Value (PVTV)= TV / (1 + r)10= US$39b÷ ( 1 + 9.7%)10= US$16b
The total value is the sum of cash flows for the next ten years plus the discounted terminal value, which results in the Total Equity Value, which in this case is US$35b. In the final step we divide the equity value by the number of shares outstanding. Compared to the current share price of US$147, the company appears about fair value at a 6.5% discount to where the stock price trades currently. The assumptions in any calculation have a big impact on the valuation, so it is better to view this as a rough estimate, not precise down to the last cent.
Important Assumptions
The calculation above is very dependent on two assumptions. The first is the discount rate and the other is the cash flows. You don't have to agree with these inputs, I recommend redoing the calculations yourself and playing with them. The DCF also does not consider the possible cyclicality of an industry, or a company's future capital requirements, so it does not give a full picture of a company's potential performance. Given that we are looking at Diamondback Energy as potential shareholders, the cost of equity is used as the discount rate, rather than the cost of capital (or weighted average cost of capital, WACC) which accounts for debt. In this calculation we've used 9.7%, which is based on a levered beta of 1.278. Beta is a measure of a stock's volatility, compared to the market as a whole. We get our beta from the industry average beta of globally comparable companies, with an imposed limit between 0.8 and 2.0, which is a reasonable range for a stable business.
SWOT Analysis for Diamondback Energy
Strength
Earnings growth over the past year exceeded its 5-year average.
Debt is well covered by earnings and cashflows.
Dividends are covered by earnings and cash flows.
Dividend is in the top 25% of dividend payers in the market.
Weakness
Earnings growth over the past year underperformed the Oil and Gas industry.
Shareholders have been diluted in the past year.
Opportunity
Good value based on P/E ratio and estimated fair value.
Threat
Annual earnings are forecast to decline for the next 3 years.
Looking Ahead:
Whilst important, the DCF calculation is only one of many factors that you need to assess for a company. DCF models are not the be-all and end-all of investment valuation. Preferably you'd apply different cases and assumptions and see how they would impact the company's valuation. For instance, if the terminal value growth rate is adjusted slightly, it can dramatically alter the overall result. For Diamondback Energy, we've compiled three important factors you should consider:
Risks: For example, we've discovered 5 warning signs for Diamondback Energy (1 shouldn't be ignored!) that you should be aware of before investing here.
Management:Have insiders been ramping up their shares to take advantage of the market's sentiment for FANG's future outlook? Check out our management and board analysis with insights on CEO compensation and governance factors.
Other Solid Businesses: Low debt, high returns on equity and good past performance are fundamental to a strong business. Why not explore our interactive list of stocks with solid business fundamentals to see if there are other companies you may not have considered!
PS. Simply Wall St updates its DCF calculation for every American stock every day, so if you want to find the intrinsic value of any other stock just search here.
Have feedback on this article? Concerned about the content? Get in touch with us directly. Alternatively, email editorial-team (at) simplywallst.com.
This article by Simply Wall St is general in nature. We provide commentary based on historical data and analyst forecasts only using an unbiased methodology and our articles are not intended to be financial advice. It does not constitute a recommendation to buy or sell any stock, and does not take account of your objectives, or your financial situation. We aim to bring you long-term focused analysis driven by fundamental data. Note that our analysis may not factor in the latest price-sensitive company announcements or qualitative material. Simply Wall St has no position in any stocks mentioned.
Join A Paid User Research Session
You’ll receive a US$30 Amazon Gift card for 1 hour of your time while helping us build better investing tools for the individual investors like yourself. Sign up here
