Despite delivering investors losses of 51% over the past 5 years, Hargreaves Lansdown (LON:HL.) has been growing its earnings
We think intelligent long term investing is the way to go. But unfortunately, some companies simply don't succeed. To wit, the Hargreaves Lansdown plc (LON:HL.) share price managed to fall 59% over five long years. That's an unpleasant experience for long term holders.
While the last five years has been tough for Hargreaves Lansdown shareholders, this past week has shown signs of promise. So let's look at the longer term fundamentals and see if they've been the driver of the negative returns.
Check out our latest analysis for Hargreaves Lansdown
There is no denying that markets are sometimes efficient, but prices do not always reflect underlying business performance. One flawed but reasonable way to assess how sentiment around a company has changed is to compare the earnings per share (EPS) with the share price.
During the unfortunate half decade during which the share price slipped, Hargreaves Lansdown actually saw its earnings per share (EPS) improve by 6.5% per year. So it doesn't seem like EPS is a great guide to understanding how the market is valuing the stock. Alternatively, growth expectations may have been unreasonable in the past.
Due to the lack of correlation between the EPS growth and the falling share price, it's worth taking a look at other metrics to try to understand the share price movement.
The steady dividend doesn't really explain why the share price is down. It's not immediately clear to us why the stock price is down but further research might provide some answers.
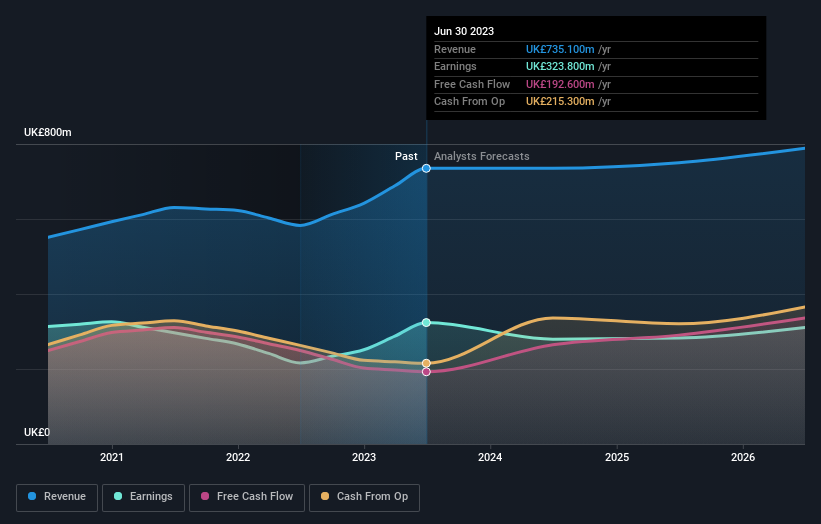
The image below shows how earnings and revenue have tracked over time (if you click on the image you can see greater detail).
It's probably worth noting that the CEO is paid less than the median at similar sized companies. It's always worth keeping an eye on CEO pay, but a more important question is whether the company will grow earnings throughout the years. You can see what analysts are predicting for Hargreaves Lansdown in this interactive graph of future profit estimates.
What About Dividends?
As well as measuring the share price return, investors should also consider the total shareholder return (TSR). Whereas the share price return only reflects the change in the share price, the TSR includes the value of dividends (assuming they were reinvested) and the benefit of any discounted capital raising or spin-off. It's fair to say that the TSR gives a more complete picture for stocks that pay a dividend. We note that for Hargreaves Lansdown the TSR over the last 5 years was -51%, which is better than the share price return mentioned above. And there's no prize for guessing that the dividend payments largely explain the divergence!
A Different Perspective
Hargreaves Lansdown shareholders are down 8.6% for the year (even including dividends), but the market itself is up 1.0%. However, keep in mind that even the best stocks will sometimes underperform the market over a twelve month period. Unfortunately, longer term shareholders are suffering worse, given the loss of 9% doled out over the last five years. We would want clear information suggesting the company will grow, before taking the view that the share price will stabilize. I find it very interesting to look at share price over the long term as a proxy for business performance. But to truly gain insight, we need to consider other information, too. For instance, we've identified 3 warning signs for Hargreaves Lansdown (2 make us uncomfortable) that you should be aware of.
Of course Hargreaves Lansdown may not be the best stock to buy. So you may wish to see this free collection of growth stocks.
Please note, the market returns quoted in this article reflect the market weighted average returns of stocks that currently trade on British exchanges.
Have feedback on this article? Concerned about the content? Get in touch with us directly. Alternatively, email editorial-team (at) simplywallst.com.
This article by Simply Wall St is general in nature. We provide commentary based on historical data and analyst forecasts only using an unbiased methodology and our articles are not intended to be financial advice. It does not constitute a recommendation to buy or sell any stock, and does not take account of your objectives, or your financial situation. We aim to bring you long-term focused analysis driven by fundamental data. Note that our analysis may not factor in the latest price-sensitive company announcements or qualitative material. Simply Wall St has no position in any stocks mentioned.
